Translate this page from English into :

Friday, August 29, 2008

Banks Borrow More from Fed Again

According to International Herald Tribune today, Banks borrowed more over the past week from the Federal Reserve's emergency lending program, while Wall Street firms passed for the fourth straight week.

A Fed report released Thursday said commercial banks averaged $18.47 billion in daily borrowing over the past week. That compared with a daily average of $17.51 billion in the previous week.

For the week ending Aug. 27, Wall Street firms didn't take out any loans, the fourth straight period of no action. Their borrowing, however, averaged as high as $38.1 billion a day over the course of a week in early April.

Separately, as part of efforts to relieve credit strains, the Fed auctioned nearly $26.65 billion in Treasury securities to investment companies Thursday. The Fed was making $50 billion worth of the securities available.

In exchange for the 28-day loans of Treasury securities, bidding companies can put up as collateral more risky investments. These include certain mortgage-backed securities and bonds secured by federally guaranteed student loans.

The auction program, which began March 27, is intended to make investment companies more inclined to lend to each other. A second goal is providing relief to the distressed market for mortgage-linked securities and for student loans.

Related Posts :

A New Hundreds of Billions Dollar of Debt Coming Due

Please Note!
This is generally never true. Before buying or selling any stock you should do your own research and reach your own conclusion. See my Disclaimer on the bottom for more information.

You are welcome to republish this article, or any portion thereof.
Please, cite the actual/original source. I would be grateful if you could link back.



Stumble Upon Toolbar Add to Technorati Favorites Bookmark and Share

Thursday, August 28, 2008

IEA Ready to Release Oil Stocks If Storm Hits


According to Reuters today, The International Energy Agency (IEA) is ready to release strategic oil stocks if Tropical Storm Gustav hits the Gulf of Mexico oil hub early next week, the energy adviser to 27 rich nations said on Thursday. "It's too early to think of any implications yet but we are closely following this with the U.S. government," Aad van Bohemen, head of the emergency planning and the preparation division at the IEA. Crude oil fell more than $2 a barrel after IEA's state.

As Bloomberg wrote :
    "The IEA is making the right soothing noises to calm the market," said Phil Flynn, senior trader at Alaron Trading Corp. in Chicago. "Anyone who follows the industry would expect them to release supplies if there was a great deal of damage, but this is an emotional market and words can do a lot."

    The Gulf of Mexico is home to 26 percent of U.S. oil output and 14 percent of the country's gas production. Katrina closed 95 percent of offshore output in the region. Almost 19 percent of U.S. refining capacity was idled because of damage and blackouts caused by Katrina and Rita.

    Gustav is the seventh named storm of the Atlantic hurricane season, which runs from June 1 through Nov. 30. The National Oceanic and Atmospheric Administration's forecasters predict 14 to 18 named storms will develop this year.

    Brent crude oil for October settlement fell $2.05, or 1.8 percent, to settle at $114.17 a barrel on London's ICE Futures Europe exchange.

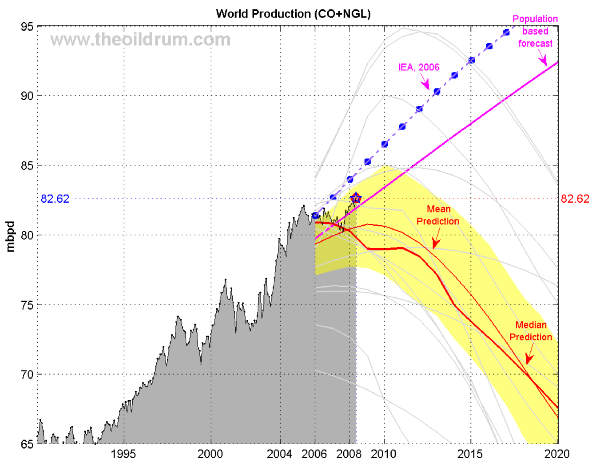
The chart below is An update on the latest production numbers from the EIA along with graphs/charts of different oil production forecasts.

Click to Enlarge

World oil production (EIA Monthly) for crude oil + NGL. The median forecast is calculated from 14 models that are predicting a peak before 2020 (Bakhtiari, Smith, Staniford, Loglets, Shock model, GBM, ASPO-[70,58,45], Robelius Low/High, HSM). 95% of the predictions sees a production peak between 2008 and 2010 at 77.5 - 85.0 mbpd (The 95% forecast variability area in yellow is computed using a bootstrap technique).

Click to Enlarge
As shown by the USO chart above, it has the parabolic shape as George Soros said on Interview with Telegraph TV on April 6:
    "Speculation... is increasingly affecting the price, The price has this parabolic shape which is characteristic of bubbles".

Related Posts :
  1. George Soros and Our "Superbubble"
  2. George Soros and Paul Tudor Jones Commented on Oil Bubble
Please Note!
This is generally never true. Before buying or selling any stock you should do your own research and reach your own conclusion. See my Disclaimer on the bottom for more information.

You are welcome to republish this article, or any portion thereof.
Please, cite the actual/original source. I would be grateful if you could link back.


Stumble Upon Toolbar Add to Technorati Favorites Bookmark and Share

George Soros and Our "Superbubble"


From OnPointRadio.org, As the economy shakes, a conversation with George Soros on July 9 :
    Billionaire investor, philanthropist, and political player George Soros made his fortune riding the winds of high finance.

    Now, he says, the global economy is blowing out of a tremendous bubble. Not a normal bubble, but a “superbubble” that’s coming apart in a superbust.

    Soros was there for the dawn of the hedge fund and the high-leverage finance that’s now coming back to bite — in housing and oil and debt and a credit crunch. We’re in for financial destruction and a breakdown of world order, he says. Oh, great.
George Soros, through his Soros Fund Management LLC, hiked his stake in Lehman Brothers Inc. (LEH) to 9.5 million shares as of June 30 from just 10,000 shares, giving him a 1.4% stake, according to a regulatory filing on August 15. It shows Soros is betting that Lehman won't befall the same fate as Bear Stearns.

Related Posts :

George Soros and Paul Tudor Jones Commented on Oil Bubble

Please Note!
This is generally never true. Before buying or selling any stock you should do your own research and reach your own conclusion. See my Disclaimer on the bottom for more information.

You are welcome to republish this article, or any portion thereof.
Please, cite the actual/original source. I would be grateful if you could link back.


Stumble Upon Toolbar Add to Technorati Favorites Bookmark and Share

A New Hundreds of Billions Dollar of Debt Coming Due

From WSJ:
    U.S. and European banks, already burdened by losses and concerns about their financial health, face a new challenge: paying off hundreds of billions of dollars of debt coming due.

    At issue are so-called floating-rate notes -- securities used heavily by banks in 2006 to borrow money. A big chunk of those notes, which typically mature in two years, will come due over the next year or so, at a time when banks are struggling to raise fresh funds. That's forcing banks to sell assets, compete heavily for deposits and issue expensive new debt.

    Most of the floating-rate notes are denominated in dollars. But redemptions of notes denominated in euros also loom for European and U.S. banks. In the final four months of this year, some €15 billion to €20 billion will come due every month, says Mr. Stear, the Société Générale strategist. That compares with some €7 billion to €15 billion that came due every month in the first half of 2008.

    The crunch will begin next month, when some $95 billion in floating-rate notes mature. J.P. Morgan Chase & Co. analyst Alex Roever estimates that financial institutions will have to pay off at least $787 billion in floating-rate notes and other medium-term obligations before the end of 2009. That's about 43% more than they had to redeem in the previous 16 months.

    The problem highlights how the pain of the credit crunch, now entering its second year, won't end soon for banks or the broader economy. The Federal Deposit Insurance Corp. said on Tuesday that its list of "problem" banks at risk of failure had grown to 117 at the end of June, up from 90 at the end of March.

    "It's going to be a bigger problem now than it was in the first half of this year, but it's going to continue on for probably at least a nine-month period," said Guy Stear, credit strategist at Société Générale SA in Paris.

    By the end of this year, big banks and investment banks such as Goldman Sachs Group Inc. (GS), Merrill Lynch & Co (MER), Morgan Stanley (MS), Wachovia Corp. (WB), and U.K. lender HBOS PLC must each redeem more than $5 billion in floating-rate notes, according to a recent report from J.P. Morgan (JPM). Other big lenders such as General Electric Co. (GE), Wells Fargo & Co. (WFC) and Italy's UniCredit Group also face big bills in coming months, the report says.
From Bloomberg :
    Banks sold $960.8 billion of so-called floaters between 2005 and 2007. About $260 billion, or about 30 percent, of the debt coming due in the remainder of this year is floating-rate notes. According to Alex Roever, a short-term debt analyst at JPMorgan in New York, Banks wanted to borrow the money at the cheapest levels possible and floating-rate notes helped them achieve that.

    Banks are raising rates on certificate of deposits to attract cash from new customers. Banks may be able to raise at most $110 billion in floating- rate notes, less than half the amount coming due

Related Posts :
  1. Banks' Subprime Losses Top $500 Billion on Writedowns
  2. Michael Hecht Cut His Estimates and Price Target on Lehman Brothers (LEH)
Please Note!
This is generally never true. Before buying or selling any stock you should do your own research and reach your own conclusion. See my Disclaimer on the bottom for more information.

You are welcome to republish this article, or any portion thereof.
Please, cite the actual/original source. I would be grateful if you could link back.


Stumble Upon Toolbar Add to Technorati Favorites Bookmark and Share

50 SPX Stocks Down > 50%

From The Big Picture:
    Via Mike Panzner, comes this list of the 50 down 50:

    Since the S&P 500 hit a closing peak of 1565.15 on October 9th, the benchmark has lost 18.11% (through this morning). However, 50 stocks, or 10% of the index constituents, have actually fallen by more than 50%. Not surprisingly, the biggest losers are financials, though the list also includes a few dogs from the auto, newspaper and technology sectors, among others.

    I am curious about the following: How many times has this happened before? What did the markets do 6, 12 and 24 months afterwards?

    Click through for the infamous 50:

    50 Stocks Down 50% or more from the S&P500

    Freddie Mac FRE -95.16%
    Fannie Mae FNM -92.52%
    Wamu Inc WM -89.75%
    Mbia Inc MBI -84.53%
    Natl City Corp NCC -80.85%
    Mgic Invt Corp MTG -80.14%
    Lehman Bros Hldg LEH -79.38%
    E*Trade Financia ETFC -78.65%
    Xl Capital Ltd-A XL -76.18%
    Cit Group Inc CIT -75.91%
    Regions Financia RF -73.10%
    Amer Intl Group AIG -73.04%
    General Motors GM -72.82%
    Wachovia Corp WB -72.44%
    Sandisk Corp SNDK -70.58%
    Slm Corp SLM -70.54%
    Office Depot Inc ODP -68.36%
    Tesoro Corp TSO -67.48%
    Merrill Lynch MER -66.86%
    Keycorp KEY -66.66%
    Zions Bancorp ZION -65.47%
    Whole Foods Mkt WFMI -65.46%
    Titanium Metals TIE -64.53%
    Nvidia Corp NVDA -62.63%
    First Horizon Na FHN -62.61%
    Citigroup Inc C -61.61%
    Harman Intl HAR -61.12%
    Gannett Co GCI -60.91%
    Huntington Banc HBAN -60.34%
    Qwest Communicat Q -60.28%
    Ciena Corp CIEN -60.16%
    Marshall &Ilsley MI -59.55%
    Allegheny Tech ATI -58.97%
    Fifth Third Banc FITB -58.67%
    Sun Microsystems JAVA -58.52%
    Gen Growth Prop GGP -57.64%
    Adv Micro Device AMD -55.91%
    Liz Claiborne LIZ -55.76%
    Micron Tech MU -55.64%
    American Capital ACAS -54.09%
    Meredith Corp MDP -53.58%
    Nyse Euronext NYX -53.16%
    Valero Energy VLO -53.05%
    Legg Mason Inc LM -52.77%
    Lennar Corp-Cl A LEN -52.45%
    Cb Richard Ell-A CBG -51.57%
    Comerica Inc CMA -51.53%
    Genworth Financi GNW -51.45%
    Sprint Nextel Co S -50.27%
    Sovereign Bancor SOV -50.06%

Related Posts :

Market Lessons From 2007

Please Note!
This is generally never true. Before buying or selling any stock you should do your own research and reach your own conclusion. See my Disclaimer on the bottom for more information.

You are welcome to republish this article, or any portion thereof.
Please, cite the actual/original source. I would be grateful if you could link back.


Stumble Upon Toolbar Add to Technorati Favorites Bookmark and Share

Fertilizer Risks Increased by Higher Fuel Costs

Fields of corn grow near the cattle farm of Tanner Rowe outside of Dallas Center, Iowa, June 11, 2008. Photographer: Gary Fandel/Bloomberg News

According to Bloomberg on August 27, A U.S. Department of Agriculture report today may show costs are accelerating as revenue growth slows, similar to a pattern that led to a 1980s farm crisis that was the worst since the Great Depression, said Gary Schnitkey, a University of Illinois farm economist. Corn, wheat and soybean prices are all at least 18 percent below their peaks.

Fertilizer, the second-biggest expense for corn and soybean farmers after land, is tied to spiraling energy costs, said Bob Young, chief economist for the American Farm Bureau Federation. Fertilizer costs doubled from a year ago, while fuel increased 62 percent, USDA data show. Expenses probably will surpass the $279.2 billion that the USDA estimated in February, eroding net income the government pegged at a record $92.3 billion for 2008, farmers and economists said.

"Income peaked this year," said Kurt Line, who owns or manages more than 6,800 acres of farmland near Momence, Illinois. "We should see a significant drop in 2009. For the number of dollars we will be risking the next two years, profit margins are not going to be robust."

Total farm income, a broad measure of revenue, rents, government aid and other benefits from agricultural operations, will be $371.5 billion this year, according to USDA estimates in February that will be revised in today's report. Adjusted for inflation, the figure is the highest since 1979. The USDA's first forecast of 2009 farm income will be made in November.


Related Posts :

The Agriculture's Bear Market

Please Note!
This is generally never true. Before buying or selling any stock you should do your own research and reach your own conclusion. See my Disclaimer on the bottom for more information.

You are welcome to republish this article, or any portion thereof.
Please, cite the actual/original source. I would be grateful if you could link back.


Stumble Upon Toolbar Add to Technorati Favorites Bookmark and Share

Wednesday, August 20, 2008

Long and Short Ideas Today, August 20 2008

According to Bloomberg on August 19, Goldman Sachs Group Inc (GS). analysts led by William Tanona slashed earnings estimates for banks and brokerage firms and recommended that investors buy shares in Morgan Stanley(MS) while selling Citigroup Inc(C). William Tanona increased loss estimates for many of its peers, and warned the financial crisis is far from over:
    "We believe a major recovery is still a few quarters away, as we anticipate additional asset sales and write-downs in coming quarters throughout the financial services sector."
Tanona trimmed Q3 EPS estimates for Lehman (LEH) (from +$0.68 to -$2.75!), Morgan Stanley (MS), JPMorgan (JPM), Merrill Lynch (MER) and Citigroup (C). He suggests clients sell Citi, and buy Morgan Stanley (MS) - the strongest positioned broker.

According to Barron's, Eric Sprott, the CEO of Sprott Asset Management, is a bull on energy, and a bear on nearly everything else. Sprott said that many coal stocks have had huge rallies, and takeovers of coal companies will provide plenty of opportunities for investors. For example, Alpha Natural Resources (ANR) has already agreed to be acquired by Cleveland-Cliffs (CLF), but there's a rumor that ArcelorMittal (MT), the world's top steel company, might make a bid.

He said, "There's hardly a financial name that we aren't short". He shorts Bank of America (BAC), JPMorgan Chase (JPM), Citigroup (C), Goldman Sachs (GS), Merrill Lynch (MER), Lehman Brothers (LEH), Morgan Stanley (MS), SunTrust (STI), Wachovia (WB), Washington Mutual (WM), Capital One (COF).

Sprott believes house prices will fall further. While Gold will appreciate from here in any currency. He buys gold and silver bullion for about 25% of their funds.


Related Posts :
  1. Gold Stock's Profit and Margin Charts
  2. Valuations are The Key to Long-Term Returns
  3. There’s Never Been A 300-Point Rally in A Bull Market
  4. US Stocks are Still Overvalued
  5. Short Ideas Today, July 23, 2008
  6. Regional Banks Collapse Snow Ball Seems to Continue Rolling Downhill
  7. Short Suntrust Bank, Inc. (STI)
Please Note!
This is generally never true. Before buying or selling any stock you should do your own research and reach your own conclusion. See my Disclaimer on the bottom for more information.

You are welcome to republish this article, or any portion thereof.
Please, cite the actual/original source. I would be grateful if you could link back.


Stumble Upon Toolbar Add to Technorati Favorites Bookmark and Share

Tuesday, August 19, 2008

5 Potential Buyout Targets in Biotech - Barron's

Rachael Granby, An SA Editor, on August 17 wrote an article entitled "5 Potential Buyout Targets in Biotech - Barron's", here is:
    Bristol-Myers Squibb (BMY) made a $4.5B bid for the shares of ImClone (IMCL) it doesn't already own. Roche Holdings (RHHBY.PK) made a $44B offer for the shares of Genetech (DNA) it doesn't own. Both targets want the bid prices raised. Barron's Lawrence Strauss says these are just the two latest examples of an increasingly common biotech strategy to use mergers, buyouts, and takeovers as a way to fatten product pipeline (and profit) by acquiring promising and pre-tested biotech drugs.

    Big Pharma is feeling the need to find new products with blockbuster potential as several important drugs approach the expiration of their patent protection. This, of course, will open the market to cheaper, generic versions of the drug, cutting into Big Pharma profit. Leading the pack will be Pfizer's (PFE) cholesterol drug, Lipitor, which generated more than $12B in global sales last year. Other companies with expiring blockbuster patents include Wyeth (WYE), Merck (MRK), and Eli Lilly (LLY). Jay Markowitz, a T. Rowe Price health-care analyst, notes "a number of companies are facing a significant patent cliff, where billions in revenues are going to disappear."

    Many large pharmaceuticals have lots of cash on their balance sheets, making acquisitions an affordable option. The weaker dollar has also made U.S. companies look more attractive to biotech and pharmaceutical firms abroad. Another major factor is the difficult process of receiving FDA approval. This lengthy and grueling process provides an additional incentive to buy companies that have already received FDA approval on their drugs, ensuring smooth pipeline production going forward.

    Potential buyout targets to keep an eye on: Amylin Pharmaceuticals (AMLN), United Therapeutics (UTHR), Alexion Pharmaceuticals (ALXN), Onyx Pharmaceuticals (ONXX), Vertex Pharmaceuticals (VRTX).
As writen by valleywag.com, Genentech(DNA) laughs off $43.7 billion buyout offer. The Company Location is just a few miles north of Google that pulls in more than $10 billion a year selling drugs.


Genentech makes the cancer treatment Avastin, the arthritis and lymphoma drug Rituxan, and the breast cancer fighter Herceptin, each of which bring in a few billion a year. Its stock, which trades under the symbol DNA, nearly touched $100 a share yesterday, a three-year high. Market cap is just over $100 billion, not far behind Google's $118 billion. Once you know all that, it's not surprising that the company nixed a buyout offer from Roche, its majority shareholder. San Francisco's bid to become the world's biotech center is moving more slowly than planned, but just you wait another ten years. These little drug companies are going to get a lot bigger.

Related Posts :

Please Note!
This is generally never true. Before buying or selling any stock you should do your own research and reach your own conclusion. See my Disclaimer on the bottom for more information.

You are welcome to republish this article, or any portion thereof.
Please, cite the actual/original source. I would be grateful if you could link back.


Stumble Upon Toolbar Add to Technorati Favorites Bookmark and Share

Monday, August 18, 2008

How You Turn $100,000 into $5 Million

By Porter Stansberry
dailywealth.com
April 19, 2008


Learning to truly enjoy bear markets – to lust for them – is not easy.

Especially for novice investors, the idea of putting more money to work in bad markets makes about as much sense as running into a burning building. Nevertheless, as I'll show you today, this is an excellent way to make big gains during bear markets, while positioning your portfolio for huge profits once the bull returns.

In my career as an investment analyst, I've seen at least a half dozen bona fide bear markets. The first three occurred during the emerging-markets meltdown of 1997-1998, which began in Asia with the Thai baht devaluation.

I took a research trip to Argentina and Brazil in the summer of 1998. I spent a week in Buenos Aires and a week in Sao Paulo. Young investment bankers showed me around both cities. Three things shocked me: the motorcycle drivers, the prevalence of prostitution (I was young and naïve), and how you could buy every single stock in Brazil for less than four times earnings.

If I'd only had the capital and the conviction I have now, I would have bought every single blue-chip stock in Brazil. If only I'd put $10,000 in a dozen companies back then!

To give you an idea of how lucrative that might have been, since 2002, the iShares Brazil index fund (EWZ) has gone from $5 to $88. This fund didn't exist in 1998, but if it had, it would have traded for less than $2. I believe you would have made about 50 times your money over the years if you'd bought Brazil in 1998. That's how you turn $100,000 into $5 million.

I was there. And I could have done it – except I didn't have the capital or the confidence to believe what my brain was telling me. I won't make that mistake again, believe me...

That bear market and others taught me stock prices can fall farther than anyone can imagine and, if you're patient, it's possible to make stupendous profits in stocks, especially if you're willing to buy when no one else will. These lessons helped me begin buying stocks heavily near the exact bottom in 2002...

Stock prices had simply reached the point where we could safely buy the highest-quality stocks in America – like Exelon, which we've owned in my advisory since October 2002 issue. We bought the most efficient producer of electricity in America and the largest nuclear energy operator for 10 times earnings. You had to be dumb not to buy Exelon at that price.

But after a dozen years studying markets around the world, the one thing I know for certain is: Most people will only buy stocks when they shouldn't and will absolutely not buy stocks when they should.

If I can convince just one reader of this essay to ignore his emotions, forget his fears, and buy high-quality stocks when they're cheap – and ignore everything else – I will have accomplished something. This lesson is very important given the state of today's stock market.

With the S&P 500 down 24% from its peak to its recent trough, we are in the midst of a real bear market. My belief today is stock prices – on average – are going to go lower.

While most of your financial advisors will undoubtedly tell you to trim your exposure to stocks and "batten down the hatches" financially – you will get the opposite advice from me. Do you think Warren Buffett, Sam Zell, Marty Whitman, Bill Gross, Jim Rogers, Jeremy Grantham, Steve Leuthold, Mark Mobius, or any other extraordinarily successful long-term investor trims his portfolio during bear markets? Absolutely not. That's when they put their cash reserves to work.

Great investments are made during bear markets. Great investors earn their reputations during bear markets. The fortune you hope to gain from the markets will be made by what you do during bear markets. It's easy to buy and hold during good times. It is much, much more difficult to put money to work in critical situations when you have to go against the crowd and your own fears.

To my knowledge, there's only one way to do the right thing during these critical times: You must know how to evaluate equity values. And you must understand the margin of safety you have in your investments. Without this knowledge, it is nearly impossible to sit on your hands and hold on. If you don't have firm knowledge of the value of your stocks and confidence in their intrinsic value, you will eventually cave in to your fears. You'll join the panic – at exactly the wrong moment.

But... if you know the value of what you own and if you're confident in the "margin of safety" in your investments, you should have absolutely nothing to fear.

If you'll do this simple thing – buy value, and know that you own extremely high-quality business – you can prosper during the bear market, while you wait for the perfect moment of panic to arrive. For instance, right now, we own (and recommend buying more at current prices) Intel (INTC), one of the all-time elite global businesses.

Intel is one of only a handful of companies that has been able to grow its earnings 20% annually, for more than 20 years. Around 60% of Intel's sales come from Asia. If you believe in the growth of China and the rest of Asia, Intel might be the best way to play it. Intel plays such a critical role in the supply of silicon tools, any argument you make about Asian growth is a bullish argument for Intel. Intel's huge investments each year into research & development ensures it improves its products at a pace none of its rivals are able to match.

Do you think you'll get hurt buying Intel right now at just over 10 times cash flow? Absolutely not. This kind of certainty gives you the ability to sleep soundly during bear markets.

Right now, you're being given a fantastic opportunity to build a super-high-quality portfolio at prices that almost guarantee you'll see high average returns over the next several years. All you have to do is be selective and patient – the things most investors can't do.

Now, if you can understand why fear and bear markets are truly good for us, you'll take dire financial situations in stride... You'll know they present outstanding opportunities to build wealth for the long term.

Good investing,

Porter Stansberry

Related Posts :

Sir John Templeton's 16 Rules of Investment Success

Please Note!
This is generally never true. Before buying or selling any stock you should do your own research and reach your own conclusion. See my Disclaimer on the bottom for more information.

You are welcome to republish this article, or any portion thereof.
Please, cite the actual/original source. I would be grateful if you could link back.


Stumble Upon Toolbar Add to Technorati Favorites Bookmark and Share

Thursday, August 14, 2008

Michael Hecht Cut His Estimates and Price Target on Lehman Brothers (LEH)

According to Jonathan Kennedy's Article on ClusterStock.com, Michael Hecht, A Bank ofAmerica'a Analyst, joins Deutsche Bank's Mike Mayo and Merrill Lynch's Guy Moszkowski, who also lowered their outlooks for Lehman this week. Hecht also said that the sale of Lehman's asset management arm Neuberger Berman wouldn't be motivated by the need for capital, but rather by the desire to "unlock shareholder value."

Hecht cut his estimates and price target on Lehman Brothers (LEH) this morning, citing the firm's exposure to the debt markets. He said that while on the one hand Lehman has successfully transformed from a one-business firm to a more diversified investment bank, Lehman remains the most fixed-income sensitive firm. Asset management remains a highly valuable asset, leading us to believe that a potential Neuberger monetization would not be motivated by capital shortfall but rather unlocking shareholder value and we think leaves the door open for a partial spin versus outright sale.

There are certainly parts of Lehman's business that are attractive, but it still has $20 billion of Alt-A mortgages and $40 billion in commercial real estate loans on its balance sheet. These would likely pose a concern to any potential acquirer despite the firm's relatively high tier 1 ratio.

Hecht maintains his Neutral rating and cuts his price target from $23 to $20.

Wachovia (WB) and BOFA (BAC) Have Bottomed; Meredith Whitney Missed Boat (WB, BAC, JPM, MER)

Meanwhile Tom Brown of Second Curve Capital and Bankstocks.com says the most famous stock analyst in the country, Meredith Whitney, has missed the turn in financial stocks. The sector will double or triple in short order, Tom says--including Wachovia (WB)--and some stocks will charge even higher. Tom's key arguments, some of which are expressed in the interview below:
  1. The stocks rally before fundamentals (in this case bad loans) peak
  2. Most companies have plenty of capital (contrary to the bear argument)
  3. Core earnings power remains strong
  4. Valuations now take into account the rest of the downturn


Tom's been early on this call before, obviously. But he's right about stocks rallying before fundamentals.

The big question is whether future writeoffs from Alt-A, prime, credit cards, auto loans, and commercial real-estate loans will force banks to raise additional capital (and, if so, how much). Meredith remains steadfast in her belief that banks (and investors) are still underestimating the future carnage. Tom thinks the worst-case scenario is already in the stocks. Except for WaMu (WM).

Related Posts :
  1. The Turn in the Financials: If You Wait for Good News, You’ll Wait Too Long
  2. The Citi Killer Strikes C, UBS, MER, BAC and WB
  3. Six Reasons to Short Financial Sector Again
  4. There’s Never Been A 300-Point Rally in A Bull Market
  5. US Stocks are Still Overvalued
Please Note!
This is generally never true. Before buying or selling any stock you should do your own research and reach your own conclusion. See my Disclaimer on the bottom for more information.

You are welcome to republish this article, or any portion thereof.
Please, cite the actual/original source. I would be grateful if you could link back.


Stumble Upon Toolbar Add to Technorati Favorites Bookmark and Share

The Turn in the Financials: If You Wait for Good News, You’ll Wait Too Long

Bottoms happen at times (like now) when everyone’s convinced there’s no hope


By Thomas Brown
Source: Bankstocks.com
August 8, 2008.


It’s of course my view that the financial stocks have made a bottom; I even have a strong suspicion the very day it occurred: July 15. And as I’ve noted here before, essentially no one else on the planet seems to agree with me. That’s life.

Rather, the bears insist on seeing some kind of fundamental improvement in the outlook for the sector before they’re willing to invest. So depending on whose checklist you’re reading, non-performing loans need to peak and start to decline. Or net chargeoffs need to begin to come down. Or loss provisions have to fall. Something good needs to be on the horizon.

Sorry, the stock market doesn’t work that way. Remember, the market is a discounting machine: it anticipates key events so early on the vast majority of investors don’t even think those events are possible. In the case of the financials now, that means stock prices will turn higher (and already have, I believe) when most investors believe that things are still getting worse. It happens every cycle.

So there’s no use trying to concoct your own list of mental milestones. Instead, go back and look at what happened (and in what order) during the last major credit crackup, in 1990-91. If you do, you’ll see that the bears have things all backwards. By the time their wish lists happen, the stocks will be zooming.

Take a look at the chart below. It shows banking industry net chargeoffs and loan loss provisions for the years 1988 through 1993. If you’d bought the stocks back then according to the logic most analysts are using now, you’d have dipped your toe in the water maybe in late 1991, when chargeoffs and provisioning was peaking or, more likely, in early 1992, when it was clear they’d started to fall.


And how would you have done? Not too darn well. Look at the chart again, along with the chart of an index of large-bank stocks below it. As you see, by late 1991, the recovery in stocks was already nearly half over, and the stocks had more than doubled. By 1992, they’d tripled. Nice call!


Rather, the index bottomed in October 1990, when chargeoffs and provisioning were still going up. At the time, no one thought things would get better anytime soon, (they were right!) the same way no one seems to think things are going to get better any time soon now.

As I say, I believe the financials have made their bottom. Valuations are compelling, and the companies’ earnings outlooks have at least begun to stabilize. In particular, in the quarter just past, the inflow of new problem loans began to fall, and the rate at which early-stage delinquencies rolled into later-stage buckets declines. That’s what the beginning of an improvement looks like. Investor anxiety, meanwhile, is at a peak.

Eventually, these small glimmers of improvement will lead to what the bears say they want to see: a decline in problem loans, say, or declining net chargeoffs. The problem is, by the time that happens, the stocks will already have soared.

Last cycle, smart investors began buying at the first, tentative signs of improvement. That’s what smart investors should be doing now, too.

What do you think? Let me know!


Related Posts :
  1. There’s Never Been A 300-Point Rally in A Bull Market
  2. Six Reasons to Short Financial Sector Again
  3. US Stocks are Still Overvalued
  4. Market Lessons From 2007
  5. Valuations are The Key to Long-Term Returns
  6. Dow Jones 300+ Point Moves and Bear Markets
  7. GS was Downgraded: The Credit Markets Will Not Calm Down Until Housing Prices Stabilize
  8. The Citi Killer Strikes C, UBS, MER, BAC and WB

Please Note!
This is generally never true. Before buying or selling any stock you should do your own research and reach your own conclusion. See my Disclaimer on the bottom for more information.

You are welcome to republish this article, or any portion thereof.
Please, cite the actual/original source. I would be grateful if you could link back.


Stumble Upon Toolbar Add to Technorati Favorites Bookmark and Share

Wednesday, August 13, 2008

There’s Never Been A 300-Point Rally in A Bull Market

I found an interesting article written by Keith Fitz-Gerald, An Investment Director of Money Morning, on August 12 2008. He wrote, "Yet, at the same time, the Dow puts in two barnburners like those last Tuesday and Friday when the index rose 331.62 and 302.89 points respectively. Which begs the question… what do we make of the rallies?

Two words – 'bear trap'."

David Rosenburg, an investment analyst with Merrill Lynch & Co. Inc. (MER), points out something we know from our own proprietary research to be true. There’s never been a 300-point rally in a bull market. Let alone two of them in one week.

Click to Enlarge


Keith added that If history holds true, then there are three key takeaways:

  1. Until the rebound reflects stronger earnings, sales growth and a generally improving economic scenario, rapid upside moves like those last week are nothing more than king-sized bear traps ready to snare the unsuspecting.

  2. Companies are girding for rougher times ahead by selling into strength. This would not be the case if things were truly getting better. Nor would London Interbank Offered Rate (LIBOR) /Treasury spreads be widening the way they have been recently.

  3. What we are experiencing now is nothing more than a continuation of the broader bear market patterns that began in 2000 and which may continue through 2012 or 2015.


Related Posts :
  1. Six Reasons to Short Financial Sector Again
  2. US Stocks are Still Overvalued
  3. Market Lessons From 2007
  4. Valuations are The Key to Long-Term Returns
  5. Dow Jones 300+ Point Moves and Bear Markets
Please Note!
This is generally never true. Before buying or selling any stock you should do your own research and reach your own conclusion. See my Disclaimer on the bottom for more information.

You are welcome to republish this article, or any portion thereof.
Please, cite the actual/original source. I would be grateful if you could link back.


Stumble Upon Toolbar Add to Technorati Favorites Bookmark and Share

Six Reasons to Short Financial Sector Again

Here is the article of Trade Radar Operator on SA today entitled "Six Reasons To Buy UltraShort Financials Again":
    Here are my reasons why I think now is a good time to own SKF:

    1. Financial stocks are emerging from earnings season. The somewhat misplaced enthusiasm over the way many of the financials exceeded drastically lowered expectations is beginning to fade. In terms of year-over-year results, these stocks, pretty much across the board, stunk up the place. We are now seeing some analyst downgrades, even for the likes of Goldman Sachs.

    2. The winds of adversity are blowing in the direction of the financials again. Auction Rate Securities are negatively impacting a range of financial institutions. They are engaged in buying back illiquid securities and are facing potential fines as the New York Attorney General generally makes life miserable for them. It appears that bonds backed by consumer loans and credit card debt are becoming increasingly shaky. Credit requirements are tightening according to surveys of loan officers so lending is slowing. Merger and buyout activity has slowed drastically, curbing yet another potential earnings stream.

    3. Housing has not improved. Indeed, we have probably seen the peak for 2008. It is already August and as fall approaches, the residential real estate market will go into hibernation until spring of 2009. This won't help the mortgages or mortgage-backed securities still on the balance sheets of many financials.

    4. The SEC ban on naked shorting of financial stocks is set to expire on Wednesday.

    5. We have seen the short energy/buy financials trade evolve into short energy/buy tech. Tech stocks are getting all the attention and financials are getting all the bad press.

    6. SKF had fallen to support at about the $110 range (see the horizontal line on the chart below) and was trading at its 200-day moving average. On Monday the ETF dropped nearly to $106 but recovered and closed over $110. With the fundamental picture for financials deteriorating once again, it appears safe to buy SKF again. As I have written in prior posts, though, it doesn't pay to chase the ultra ETFs. Having fallen from its July peak of over $200 down to $110, Monday looked like it was presenting a pretty good entry point so I picked up the ETF at $111 and change.

      Closing yesterday at $119.75, SKF has at least started out on the right foot. If the financials wilt as I expect, it may not be too late to jump on this trade.

Related Posts :
  1. GS was Downgraded: The Credit Markets Will Not Calm Down Until Housing Prices Stabilize
  2. US Stocks are Still Overvalued
  3. Banks' Subprime Losses Top $500 Billion on Writedowns
Please Note!
This is generally never true. Before buying or selling any stock you should do your own research and reach your own conclusion. See my Disclaimer on the bottom for more information.

You are welcome to republish this article, or any portion thereof.
Please, cite the actual/original source. I would be grateful if you could link back.


Stumble Upon Toolbar Add to Technorati Favorites Bookmark and Share

GS was Downgraded: The Credit Markets Will Not Calm Down Until Housing Prices Stabilize

According to David Reilli's article on WSJ entitled "Home Prices Hold Key", J.P. Morgan Chase warned of $1.5 billion in mortgage-related losses in the still-nascent third quarter and after a pair of prominent analysts downgraded Goldman Sachs Group.

A Goldman Sachs-led (GS) group, including Alpinvest Partners and Canada Pension Plan, is paying about $1.5B for a large portfolio of existing private-equity investments that are being divested as part of the $101B splitting up of ABN Amro (ABNYY) by Banco Santander (STD), Royal Bank of Scotland (RBS) and Fortis, according to the Wall Street Journal.

A Deutsche Bank(DB)'s Analyst, Mike Mayo, downgraded GS on August 12 citing the company's high exposure to equities and capital market pressures, especially if there is weaker European growth. Target to $192 from $209. Mayo cut his price target from $209 to $192. According to Reuters, Deutsche's European economics team believes both regions are or will soon be in recession.

Goldman also has among the highest exposures to equities during a period of more significant equity market declines, including areas of expansion such as China, Mayo said. The result is likely to be weaker-than-expected earnings, the analyst added.

While Oppenheimer's analyst Meredith Whitney cites similar concerns, and cuts her Q3 estimates for the firm. She slashed her Q3 estimates from $3.54 to $2.15 and her FY08 estimate from $15.75 to $14.32.

Related Posts :
  1. Money Markets Getting Tighter Again
  2. The Citi Killer Strikes C, UBS, MER, BAC and WB
Please Note!
This is generally never true. Before buying or selling any stock you should do your own research and reach your own conclusion. See my Disclaimer on the bottom for more information.

You are welcome to republish this article, or any portion thereof.
Please, cite the actual/original source. I would be grateful if you could link back.


Stumble Upon Toolbar Add to Technorati Favorites Bookmark and Share

US Stocks are Still Overvalued

Here is a copy of Henry Blodget's Article on ClusterStock.com on August 13, entitled " Wish It Weren't So, But US Stocks Still Expensive":
    After a 20%-ish decline in the US stock market, it would be nice if stocks were cheap, but they aren't. The two best valuation measures we know of--cyclically adjusted P/Es and Tobin's Q--suggest US stocks are still well above their long-term averages.

    Although these (or any) valuation measures are not particularly helpful in predicting near-term market performance, they suggest stocks remain priced for mediocre long-term returns. They also suggest that the current bear market has farther to go.

Click to Enlarge

    Last month, we described the cyclically adjusted earnings measure used by Yale professor Robert Shiller, London-based economist Andrew Smithers, and others. This measure compares prices to an average of corporate earnings over the previous ten years, thus adjusting for the effects of the business cycle. Profit margins are mean-reverting--high in good times, low in bad times--so comparing the market's value to only one year can be misleading. Cyclically adjusted PEs do assume that the future will be similar to the past--which some analysts are always rightfully skeptical of--but they are far more predictive than straight PEs.

    Cambridge Associates, an institutional consulting firm, looked at the US market at the end of July using cyclically adjusted PEs and came to the same conclusion we did: It's expensive (and that was before the recent rally). The good news, as we noted last month, is that the market is less overvalued than it used to be:

    U.S. equities are overvalued. Despite the 20% decline in stock prices since October 2007, headline
    P/E ratios continue to tick higher as reported EPS fall faster than stock prices. The trailing P/E ratio
    for the S&P 500 has risen from 17.7 at the end of June 2007 (when EPS peaked) to 22.2 at the end of June 2008, as earnings have slumped by close to 30% since last June, while the S&P is down 15% over the same period. At a P/E ratio of 22 times preliminary second quarter trailing GAAP earnings of $57.66, the S&P remains 1 standard deviation above its post-1900 mean of 16.

    Normalized valuation measures [cyclically adjusted], however, show that while the S&P remains overvalued, valuations are rapidly improving, with a P/E ratio based on ten-year average real earnings at 21.5, or 0.8 standard deviation above the long-term average of 16, down sharply from 1.5 deviations back in September 2007. Indeed, at 21, the “Shiller” P/E ratio is at its lowest level since 2003. ROE-adjusted P/E ratios (based on the MSCI U.S. Index3), show U.S. equities trading at 20.5, or 0.5 standard deviation above a long-term mean of 16.

    What does all this mean? That US stocks are still priced to deliver far lower long-term returns than most investors are probably counting on: low- to mid-single digits, versus the "10% a year" that is baked into most retirement calculators.
Henry Blodget also wrote an article entitled "You Bought That Cramer "Bottom" Crap? DOW Headed Below 10,000."


Jim Cramer, Hank Paulson, Tom Brown, and a host of other pundits have pronounced the bear market dead. Barry Ritholtz thinks they're hallucinating:


Related Posts :
  1. Market Lessons From 2007
  2. Banks' Subprime Losses Top $500 Billion on Writedowns
  3. Valuations are The Key to Long-Term Returns
Please Note!
This is generally never true. Before buying or selling any stock you should do your own research and reach your own conclusion. See my Disclaimer on the bottom for more information.

You are welcome to republish this article, or any portion thereof.
Please, cite the actual/original source. I would be grateful if you could link back.


Stumble Upon Toolbar Add to Technorati Favorites Bookmark and Share

Banks' Subprime Losses Top $500 Billion on Writedowns

Bloomberg on August 12 wrote that Banks' losses from the U.S. subprime crisis and the ensuing credit crunch crossed the $500 billion mark as writedowns spread to more asset types.

The writedowns and credit losses at more than 100 of the world's biggest banks and securities firms rose after UBS AG reported second-quarter earnings today, which included $6 billion of charges on subprime-related assets.

The International Monetary Fund in an April report estimated banks' losses at $510 billion, about half its forecast of $1 trillion for all companies. Predictions have crept up since then, with New York University economist Nouriel Roubini predicting losses to reach $2 trillion.

Auction-rate securities have begun adding to the losses as regulators and prosecutors force banks to buy back bonds they'd sold as safe investments. UBS set aside $900 million to cover potential losses from repurchasing the securities, while Citigroup Inc. and Wachovia Corp. estimated losses at $500 million each.

The collapse of the U.S. subprime mortgage market last year has saddled banks worldwide with $501 billion of losses from declining values of securities tied to all types of home loans and commercial mortgages as well as leveraged-loan commitments.

Banks and brokers have raised $353 billion of capital to cope with the writedowns, according to data compiled by Bloomberg. The gap between losses and capital infusions, which now stands at $148 billion, has regularly narrowed to about $80 billion as capital raising follows writedown announcements.

Here is the total write-downs and cap raises :

click to enlarge
click to enlarge


Here is the comment of Barry Ritholtz from The Big Picture:
    Remember the good old days? Ahhh, a simpler time, when we were repeatedly told that sub-prime didn't matter, that it was contained, that the losses were a mere $60 billion dollars at most, and overall, this would have zero impact on the broader economy?

    Only not so much.

    We learned via the number crunchers at Bloomberg that the $500 Billion mark in losses and write downs has now been crossed

The $500 billion in losses don’t yet include any real Alt-A (option ARM) losses that were estimated as much as $1.6 trillion.

Related Posts :
  1. Writedowns of Largest Banks Reach $274bn
  2. Bank Collapse Update: $400 Billion of Writeoffs So Far, $600 Billion to Go (WM, WB, JPM, FNM, FRE)
  3. Bridgewater warns Bank losses from credit crisis may run to $1,600bn
Please Note!
This is generally never true. Before buying or selling any stock you should do your own research and reach your own conclusion. See my Disclaimer on the bottom for more information.

You are welcome to republish this article, or any portion thereof.
Please, cite the actual/original source. I would be grateful if you could link back.


Stumble Upon Toolbar Add to Technorati Favorites Bookmark and Share

Monday, August 11, 2008

Rio Tinto(RTP) Flags US Coal Float

According to Heraldsun.com.au on August 11, RIO Tinto(RTP) is looking to divest $US15 billion of assets after the purchase of Alcan(AL), has flagged a float of its North American coal business.

The listed company would be called Cloud Peak Energy and house most of the North American coal assets of Rio Tinto Energy America, the second largest producer of coal in the United states.

Rio Tinto said it expected to make a final decision on a potential listing, or to pursue another form of divestment, once these options had been more fully explored. Credit Suisse is the lead underwriter for the planned float.

Both the weekly and daily charts below show RTP is currently oversold. The stock prices have been slumped by about 36 percent from its peak on May 2008. A slump more than 20 percent indicates that the stock is currently in bear territory. But as a contrarian, while the stock prices are oversold, it's confirmed by the W%R and RSI indicators, it should be considered as an opportunity to go bottom fishing. But you must also be careful, because if we don’t we will catch some falling knives instead.


Related Posts :

Gold Stock's Profit and Margin Charts

Please Note!
This is generally never true. Before buying or selling any stock you should do your own research and reach your own conclusion. See my Disclaimer on the bottom for more information.

You are welcome to republish this article, or any portion thereof.
Please, cite the actual/original source. I would be grateful if you could link back.


Stumble Upon Toolbar Add to Technorati Favorites Bookmark and Share

Sir John Templeton's 16 Rules of Investment Success


"Bull markets are born on pessimism, grow on skepticism, mature on optimism, and die on euphoria. The time of maximum pessimism is the best time to buy, and the time of maximum optimism is the best time to sell."

-Sir John Templeton-


John Marks Templeton was born on November 29, 1912 in Winchester, into a poor Tennessee family. He graduated with honors from Yale, won a Rhodes Scholarship to Oxford, and then went on to bring investment insights and opportunities to everyday investors.

Shortly before the war began in Europe in 1939, he joined a brokerage in New York. His first investment coup was to turn $10,000 borrowed from his boss. His strategy was to buy all the 104 US stocks that were selling for less than $1 at the outbreak of the war. Including 34 companies that were in bankruptcy. Only four turned out to be worthless, and he turned large profits on the others as much as $40,000 after holding each for an average of four years. Templeton launched his flagship fund, Templeton Growth, Ltd. in 1954. Taking a less-traveled route in investing, he also sold advice on how to invest worldwide when Americans rarely considered foreign investment.

In investing and in life, John Templeton didn't believe in following the crowd. He was a pioneer with a unique vision and perspective whose hard work and meticulous research were his personal guideposts to success. In 1999, Money magazine called him:

"arguably the greatest global stock picker of the century"


His Sixteen Rules of Investment Success are:
  1. If you begin with a prayer, you can think more clearly and make fewer mistakes.

  2. Outperforming the market is a difficult task. The challenge is not simply making better investment decisions than the average investor. The real challenge is making investment decisions that are better than those of the professionals who manage the big institutions.

  3. Invest - don't trade or speculate. The stock market is not a casino, but if you move in and out of stocks every time they move a point or two, the market will be your casino. And you may lose eventually --or frequently.

  4. Buy value, not market trends or the economic outlook. Ultimately, it is the individual stocks that determine the market, not vice versa. Individual stocks can rise in a bear market and fall in a bull market. So buy individual stocks, not the market trend or the economic outlook.

  5. When buying stocks, search for bargains among quality stocks. Determining quality in a stock is like reviewing a restaurant. You don't expect it to be 100% perfect, but before it gets three or four stars you want it to be superior.

  6. Buy low. So simple in concept. So difficult in execution. When prices are high, a lot of investors are buying a lot of stocks. Prices are low when demand is low. Investors have pulled back, people are discouraged and pessimistic. But if you buy the same securities everyone else is buying, you'll have the same results as everyone else. By definition you can't outperform the market.

  7. There's no free lunch. Never invest on sentiment. Never invest solely in a tip. You would be surprised how many investors do exactly this. Unfortunately there is something compelling about a tip. Its very nature suggests inside information, a way to turn a fast profit.

  8. Do your homework, or hire wise experts to help you. People will tell you: investigate before you invest. Listen to them. Study companies to learn what makes them successful.

  9. Diversify - by company, by industry. In stocks and bonds, there is safety in numbers. No matter how careful you are, you can neither predict nor control the future. So you must diversify.

  10. Invest for maximum total real return. This means the return after taxes and inflation. This is the only rational objective for most long-term investors.

  11. Learn from your mistakes. The only way to avoid mistakes is not to invest - which is the biggest mistake of all. So forgive yourself for errors and certainly don't try to recoup losses by taking bigger risks. Instead, turn each mistake into a learning experience.

  12. Aggressively monitor your investments. Remember no investment is forever. Expect and react to change. And there are no stocks that you can buy and forget. Being relaxed doesn't mean being complacent.

  13. An investor who has all the answers doesn't even understand the questions. A cocksure approach to investing will lead, probably sooner than later, to disappointment if not outright disaster. The wise investor recognizes that success is a process of continually seeking answers to new questions.

  14. Remain flexible and open-minded about types of investment. There are times to buy blue-chip stocks, cyclical stocks, and convertible bonds, and there are times to sit on cash. The fact is there is no one kind of investment that is always best.

  15. Don't panic. Sometimes you won't have sold when everyone else is selling, and you will be caught in a market crash. Don't rush to sell the next day. Instead, study your portfolio. If you can't find more attractive stocks, hold on to what you have.

  16. Do not be fearful or negative too often. There will, of course, be corrections, perhaps even crashes. But over time our studies indicate, stocks do go up ….and up … and up. In this century or the next, it's still "Buy low, sell high."

Related Posts :
  1. Market Lessons From 2007
  2. Paul Tudor Jones's Rules of Trading
  3. Dennis Gartman's Rules of Trading
  4. Jim Cramer’s 25 Rules of Investing
Please Note!
This is generally never true. Before buying or selling any stock you should do your own research and reach your own conclusion. See my Disclaimer on the bottom for more information.

You are welcome to republish this article, or any portion thereof.
Please, cite the actual/original source. I would be grateful if you could link back.

Stumble Upon Toolbar Add to Technorati Favorites Bookmark and Share

A Citi's Analyst Reiterated His Buy on Google

Here is a copy from ClusterStock.com on August 8, 2008 :
    Citigroup analyst Mark Mahaney reiterated his Buy on Google (GOOG) this morning, citing the fact that Google's Q2 "normalized" earnings would have been better were it not for abnormally large professional service fees and forex hedging losses (translation: They didn't really blow the quarter, at least not for reasons worth worrying about). Also, the new would-be Google killer "Cuil" (Qwee-il), is DOA.

    Mahaney :

      G&A soared $67MM from Q1 to Q2 to reach $441MM, a record high 11.3% of net revenue. The reason? Per the Q, GOOG had a $62MM Q/Q increase in professional services fees, the majority of which were legal costs. For context, professional fees increased $15MM from Q4 to Q1. These aren’t 1X charges, but the point is that the Q2 increase was a bit unusual and helps explain the Q2 G&A bump.

      Interest Income plunged $109MM from Q1 to Q2 to $58MM. Reasons? Per the Q: 1) GOOG’s yield on its cash/investments went from 4.0% in Q1 to 2.8% in Q2; 2) GOOG went from a $47MM gain on market securities in Q1 to a $7MM gain in Q2; & 3) GOOG went from a $2MM FX gain in Q1 to a $43MM FX loss in Q2. These FX costs were due to more hedging activity under GOOG’s risk management program. The point? The Interest Income Lump in Q2 was unusual.
    .

    By Mahaney's calculations, Google's Q2 EPS would have been 19 cents higher and would have beaten analyst estimates were it not for these factors. Furthermore, Mahaney says that GOOG remains a buy because of strong organic growth and a new product cycle in 09 that includes benefits from display advertising in mobile search and video :

      The 10Q Takeaway is that “normalized” Q2 results (assuming, say, only $30MM increased professional services fees & no FX hedging losses) could have been more like $4.81 vs. the $4.62 reported. But this isn’t a reason to Buy GOOG.

      What are reasons to Buy are: 1. 30% organic bottom line growth in ’08 vs. a 25X P/E; 2. Potential opex leverage in ’09 from “normalized” personnel/capex spend; & most importantly, 3) Material new ’09 product cycles – Display Advertising, Video (YouTube), and Mobile Search.

    Finally, Mahaney concludes by peeing on Cuil:

      We’d be surprised if more Search engines weren’t launched, and we’d remind readers of Snap, which was launched shortly after GOOG’s IPO to significant fanfare. We’ve done our own (not statistically significant) sampling work on Cuil, and we conclude that the results aren’t nearly as relevant or as in-depth as Google. Our conclusion is that Cuil appears on the same growth trajectory as Snap... But we’ll continue to monitor it and the other search engines.


    Mahaney reiterates his $610 Google target.
Related Posts :

Please Note!
This is generally never true. Before buying or selling any stock you should do your own research and reach your own conclusion. See my Disclaimer on the bottom for more information.

You are welcome to republish this article, or any portion thereof.
Please, cite the actual/original source. I would be grateful if you could link back.


Stumble Upon Toolbar Add to Technorati Favorites Bookmark and Share

Market Lessons From 2007

I republish the material below from Barry Ritholtz's Article, entitled "Lessons Learned From A Dangerous Year", on The Big Picture:

    In the beginning of the year, a column I wrote for Real Money discussed some lessons of the past year. It never was moved over to the free site, so here is my belated update.

    It is a mix of fundamental, economic, technical and even philosophical lessons that those savvy CEOs, fund managers and individual investors who were paying attention picked up in the recent turmoil.

    1. Ignore market rumors :

      It seemed every time some firm was in trouble, the same gossip was floated that Warren Buffett was about to buy them. Time and again, these tales proved to be unfounded money-losers. This year's most egregious example was Berkshire's imminent purchase of Bear Stearns (BSC).

      That The New York Times Dealbook got suckered into printing this just shows you how pernicious these rumors are. The stock was as high as $123 the day of the rumor.

      Anyone who bought homebuilders or Bear Stearns stock on the basis of either of these rumors -- or nearly any other stock that had similar rumors floated throughout the year -- lost boatloads of money.

    2. Buy sector strength (and avoid sector weakness) :

      It's a truism of real estate: It's better to own a lousy house in a great neighborhood than a great house in a lousy one. And the same is true for stock sectors: Buying mediocre companies in great sectors generated positive results, while great companies in poor sectors struggled.

      The losers are obvious: The homebuilders, financials, monoline insurers and retailers all struggled this year. The winners? Anything related to agriculture, solar energy, oil servicing, industrials, software, exporters, infrastructure plays -- even asset-gatherers thrived.

    3. Never blindly follow the "big money":

      Why? Because professionals make dumb mistakes too. Many people chased the so-called smart money into these trades. Unfortunately, all of these trades have proven to be jumbo losers.

    4. Day-to-day stock action is mostly noise :

      This is blasphemy to some people, but it's true: Markets eventually get pricing right. But the key to understanding this is the word "eventually." Over the shorter term, markets frequently under- or overprice a stock before settling into the right approximation of value. This process typically occurs over broad lengths of time.

    5. P/E matters less than you think:

      If that sounds like more blasphemy, look at Google (GOOG) , Apple (AAPL) and Mosaic (MOS) -- they all sported high P/Es at the beginning of 2007 before going much higher. On the other hand, back in January '07, retailers, financials and homebuilders all had reasonably cheap P/Es. (How'd they do over the next 12 months?)

    6. Ignore deteriorating fundamentals at your peril :

      One would think this doesn't need to be said, and yet it does: When the fundamentals of a given market, sector or consumer group are decaying, profit gains are sure to slow.

    7. Nothing is more costly than chasing yield :

      For fixed-income investors, what matters most is not the return on your money, it's the return of your money. Reaching down the risk curve for a few bips of additional yield is one of the dumbest things an investor can ever do.

    8. Know what you own:

      This very basic issue was mostly forgotten in recent years, and it was forgotten by pros and individuals.

      Investment banks like Bear Stearns, Morgan Stanley (MS) and Merrill Lynch (MER) , big banks like Citigroup (C) and Washington Mutual (WM) , and GSEs like Fannie Mae (FNM) and Freddie Mac (FRE) were scooping up assets apparently without doing their homework. The complexity of these pools of mortgages almost guarantees that no one truly knows what's in them (see the next rule). If you don't know what you own, how can you properly manage risk?

    9. Simple is better than complex :

      Start with a few million mortgages of varying credit-worthiness and create a series of residential mortgage-backed securities (RMBS) from them. Then take the RMBS and stratify them. Then leverage them up into collateral debt obligations (CDOs). Once that bundling is complete, make complex bets on which layers might default, via credit default swaps (CDS).

      Gee, how could anything possibly go wrong with that?!

    10. Stick to your core competency :

      E*Trade (ETFC) is an online broker; what was it doing writing subprime mortgages?

      Why was Bear Stearns running two hedge funds?

      Isn't H&R Block a tax preparer? It was making mortgage loans -- why?

      And exactly what was GM's expertise in underwriting mortgages? (The snarkier among you might be wondering exactly what business GM's expertise is in.)

      Had these companies stuck to what they did best (or least bad), they wouldn't be in as much trouble today.

    11. Fess up! Whenever a company runs into trouble, they seem to take a page from the same PR playbook:

      First, they say nothing. Second, they deny. Finally, they make a begrudging, pitifully small admission. Eventually, the full truth falls out, and the stock tanks with it.

    12. Never forget risk management :

      Consider what could possibly go wrong, and have a plan in place in the event that unlikely possibility comes to pass. If there is to be upside, then there must also be a corresponding and proportional downside.

    13. The trend is your friend:

      Despite the year's parade of horribles, this market cliché was proven true once again. The Dow, S&P 500 and Nasdaq are all higher this year, as their long-term trends have been tested but remain intact.

      The exception, the Russell 2000, broke its trend earlier this year. That made trend traders abandon the small-cap index, which has since fallen even further. This confirms the corollary: "except for the bend at the end." As long as the index trend lines stay intact, investors can sleep easy. But once those trendlines break, well, then you better apply some of the earlier lessons (see numbers 2, 3, 4, 6, 7 and 12!).

    Looks even truer 8 months later!
Related Posts :
  1. Paul Tudor Jones's Rules of Trading
  2. Dennis Gartman's Rules of Trading
  3. Jim Cramer’s 25 Rules of Investing
Please Note!
This is generally never true. Before buying or selling any stock you should do your own research and reach your own conclusion. See my Disclaimer on the bottom for more information.

You are welcome to republish this article, or any portion thereof.
Please, cite the actual/original source. I would be grateful if you could link back.


Stumble Upon Toolbar Add to Technorati Favorites Bookmark and Share

Sunday, August 10, 2008

Valuations are The Key to Long-Term Returns

Here is a copy of apart of a John Mauldin's Weekly Letter, entitled "A New Asset Class, Part Two", August 8 2008:
    Let me offer one chart (courtesy of Vitaliy Katsenelson) from last week on this last topic, which illustrates the problem, and then we will jump into the final part of the speech. The current situation is worse than the chart depicts, because on Wednesday of this week the as-reported 12-month P/E ratio for the S&P 500 was 22.87 through the end of the second quarter. We have a LONG ways to go to revert to the mean. The only way for that to happen is for earnings to rise or for stock prices to fall, or some combination of both. Otherwise, you have to suggest we are in an era of permanently and significantly higher stock valuations. (Remember, these cycles last an average of 17 years. We are only 8 years into this one.)

    1 Year Trailing P/Es for S&P 500


    Unrealistic Expectations

    Valuations are important. They are the key to long-term returns. Your expected returns in any one 10-year period highly correlate with where you start investing. If you start when stocks are cheapest, you're going to compound at about 11 percent. But if you start when they're the most expensive, at an average PE of 22, you're going to compound at about 3.2 percent over the next 10 years. For the people and the pension funds that are expecting to get the 8 or 9 percent that they've got written into their returns in their equity portfolios, that's not good news. The following chart from my friends at Plexus illustrates the point. I should note that this calculation works not just on US stocks but in every market that I have seen studied. This is a fundamental principle of investing.

    So, what we have is a situation where many aging Baby Boomers and the pension funds and insurance companies which are investing on their behalf are not likely to be able to get the returns they need in order to meet their obligations from traditional US equity holdings.

    S&P 500 Index: Average Ten-Year Forward Real Returns


Related Posts :

Please Note!
This is generally never true. Before buying or selling any stock you should do your own research and reach your own conclusion. See my Disclaimer on the bottom for more information.

You are welcome to republish this article, or any portion thereof.
Please, cite the actual/original source. I would be grateful if you could link back.


Stumble Upon Toolbar Add to Technorati Favorites Bookmark and Share

Friday, August 8, 2008

Gold Stock's Profit and Margin Charts

Here are some charts that were provided by the SA Editors on August 8:

Annual Revenue Growth:
click to enlarge

Gross Profit Margins:
click to enlarge

Annual Earnings Growth:
click to enlarge

SG&A Margin (MRQ):
click to enlarge

Normalized Net Profit Margins:
click to enlarge


The Stocks on the charts comprise:
  1. Barrick Gold Corp. (ABX)
  2. Agnico-Eagle Mines Ltd. (AEM)
  3. Apollo Gold Corp. (AGT)
  4. AngloGold Ashanti Ltd. (AU)
  5. Yamana Gold Inc. (AUY)
  6. Banro Corp. (BAA)
  7. Bema Gold Corp. (BGO)
  8. Birch Mountain Resources Ltd. (BMD)
  9. Compania de Minas Buenaventura SA (BVN)
  10. Canyon Resources Corp. (CAU)
  11. Cambior Inc. (CBJ)
  12. Cameco Corp. (CCJ)
  13. Cardero Resource Corp. (CDY)
  14. Claude Resources Inc. (CGR)
  15. Desert Sun Mining Corp. (DEZ)
  16. DRDGOLD Ltd. (DROOY)
  17. Entree Gold Inc. (EGI)
  18. Eldorado Gold Corp. (EGO)
  19. Freeport-McMoRan Copper & Gold Inc. (FCX)
  20. FNX Mining Co. Inc. (FNXMF.PK)
  21. Great Basin Gold Ltd. (GBN)
  22. Gold Fields Ltd. (GFI)
  23. Goldcorp Inc. (GG)
  24. Glamis Gold Ltd. (GLG)
  25. Randgold Resources Ltd. (GOLD)
  26. Gammon Lake Resources Inc. (GRS)
  27. Gold Reserve Inc. (GRZ)
  28. Golden Star Resources Ltd. (GSS)
  29. Harmony Gold Mining Co. Ltd. (HMY)
  30. IAMGOLD Corp. (IAG)
  31. IMA Exploration Inc. (IMR)
  32. Ivanhoe Mines Ltd. (IVN)
  33. Kinross Gold Corp. (KGC)
  34. Crystallex International Corp. (KRY)
  35. Lihir Gold Ltd. (LIHRY)
  36. Meridian Gold Inc. (MDG)
  37. Mines Management Inc. (MGN)
  38. Miramar Mining Corp. (MNG)
  39. Northern Dynasty Minerals Ltd. (NAK)
  40. Newmont Mining Corp. (NEM)
  41. NovaGold Resources Inc. (NG)
  42. Nevsun Resources Ltd. (NSU)
  43. Northgate Minerals Corp. (NXG)
  44. Orezone Resources Inc. (OZN)
  45. Pacific Rim Mining Corp. (PMU)
  46. Queenstake Resources Ltd. (QEE)
  47. Rubicon Minerals Corp. (RBY)
  48. Royal Gold Inc. (RGLD)
  49. Richmont Mines Inc. (RIC)
  50. Rio Tinto plc (RTP)
  51. Seabridge Gold Inc. (SA)
  52. Taseko Mines Ltd. (TGB)
  53. Tanzanian Royalty Exploration Corp. (TRE)
  54. Vista Gold Corp. (VGZ)
Related Posts :

Three Reasons Why Gold Will Move Higher

Please Note!
This is generally never true. Before buying or selling any stock you should do your own research and reach your own conclusion. See my Disclaimer on the bottom for more information.

You are welcome to republish this article, or any portion thereof.
Please, cite the actual/original source. I would be grateful if you could link back.


Stumble Upon Toolbar Add to Technorati Favorites Bookmark and Share

Money Markets Getting Tighter Again

According to Bloomberg today, August 8, A year after central banks started to pump trillions of dollars into the financial system to end a seizure in credit markets caused by subprime mortgages, cash is about as tight as it's ever been. Jan Misch, a money-market trader in Stuttgart at Landesbank Baden-Wuerttemberg, Germany's biggest state-owned bank, said "Money markets are quite clearly still in a pretty bad way and that's not going to change in the foreseeable future, Banks are having to pay significant premiums to borrow cash".

The LIBOR, see the chart below, is within 0.06 percent of the highest since November 1999 compared with the Fed's benchmark interest rate. The largest financial companies have lost almost $500 billion from subprime-linked securities. It signs that Efforts by the Federal Reserve, ECB and Swiss National Bank to shore up the world's biggest banks and promote lending have had limited success.


While The U.S. market for commercial paper or short-term IOUs, backed by assets such as mortgages has shrunk 40 percent from its peak in July 2007, see the chart below. The amount borrowed in pounds between banks in the U.K. fell by 70 percent in June from a record in February 2007. The European Central Bank received $100 billion of bids for the $25 billion it offered to financial institutions on July 29, the most since the sales began in December.


Related Posts :

Please Note!
This is generally never true. Before buying or selling any stock you should do your own research and reach your own conclusion. See my Disclaimer on the bottom for more information.

You are welcome to republish this article, or any portion thereof.
Please, cite the actual/original source. I would be grateful if you could link back.


Stumble Upon Toolbar Add to Technorati Favorites Bookmark and Share