Translate this page from English into :

Thursday, October 9, 2008

Roubini Warns of Possible Systemic Meltdown, "Severe Global Depression"


From Naked Capitalism : Roubini Warns of Possible Systemic Meltdown, "Severe Global Depression", Oct 9, 2008 10:35 pm


Nouriel Roubini has been almost freakishly accurate in calling the progression of the credit crisis, with his only major failings being predicting its onset on the early side and his fondness for an apocalyptic writing style, which now seems fully justified.

Even by the standards of his alarming missives, his latest is truly troubling. Roubini effectively says the wheels are coming off the global financial system, and if corrective action is not taken immediately, the damage to the real economy will be extensive.

Note that Roubini's most recent forecast was that hedge funds would start folding due to redemptions and poor performance. This can lead to cascading destruction of value. Funds who have lost value and need to sell assets to cash out investors who want to exit sell positions into this lousy market. The selling pressure leads to price declines, which affects the value of holding of other hedge funds. At a minimum, they report losses to investors, some of whom will want out, feeding into the selling pressure. And some who have used leverage will face margin calls due to the decline in asset value, again leading to liquidation of positions.

Apparently a bit of that was behind the end-of-day fall in the Dow on Thursday. A hedge fund manager told me that apparently a West Coast hedge fund had to dump major positions, a portion of which were real estate debt related (no detail here, they might have been late entrant bottom fishers) and the prices they were getting were simply dreadful. The concern was that other banks and hedge funds would be required to use these prices for valuation of their assets, leading to further markdowns and selling pressure. The objective of the Paulson plan, to allow banks and investors to mark their books at above what would be market prices due to the Treasury's above market bids appears to have been trumped by events.

From Roubini's RGE Monitor:
    The U.S. and advanced economies’ financial systems are now headed towards a near-term systemic financial meltdown as day after day stock markets are in free fall, money markets have shut down while their spreads are skyrocketing, and credit spreads are surging through the roof. There is now the beginning of a generalized run on the banking system of these economies; a collapse of the shadow banking system, i.e. those non-banks (broker dealers, non-bank mortgage lenders, SIV and conduits, hedge funds, money market funds, private equity firms) that, like banks, borrow short and liquid, are highly leveraged and lend and invest long and illiquid, and are thus at risk of a run on their short-term liabilities; and now a roll-off of the short term liabilities of the corporate sectors that may lead to widespread bankruptcies of solvent but illiquid financial and non-financial firms.

    On the real economic side, all the advanced economies representing 55% of global GDP (U.S., Eurozone, UK, other smaller European countries, Canada, Japan, Australia, New Zealand, Japan) entered a recession even before the massive financial shocks...So we have a severe recession, a severe financial crisis and a severe banking crisis in advanced economies...

    Countries with large current account deficits and/or large fiscal deficits and with large short-term foreign currency liabilities and borrowings have been the most fragile. But even the better performing ones – like the BRICs club of Brazil, Russia, India and China – are now at risk of a hard landing. Trade and financial and currency and confidence channels are now leading to a massive slowdown of growth in emerging markets with many of them now at risk not only of a recession but also of a severe financial crisis....

    At this point the recession train has left the station; the financial and banking crisis train has left the station. The delusion that the U.S. and advanced economies contraction would be short and shallow – a V-shaped six month recession – has been replaced by the certainty that this will be a long and protracted U-shaped recession that may last at least two years in the U.S. and close to two years in most of the rest of the world. And given the rising risk of a global systemic financial meltdown, the probability that the outcome could become a decade long L-shaped recession – like the one experienced by Japan after the bursting of its real estate and equity bubble – cannot be ruled out.

    And in a world where there is a glut and excess capacity of goods while aggregate demand is falling, soon enough we will start to worry about deflation, debt deflation, liquidity traps and what monetary policy makers should do to fight deflation when policy rates get dangerously close to zero.

    At this point the risk of an imminent stock market crash – like the one-day collapse of 20% plus in U.S. stock prices in 1987 – cannot be ruled out as the financial system is breaking down, panic and lack of confidence in any counterparty is sharply rising and the investors have totally lost faith in the ability of policy authorities to control this meltdown.

    This disconnect between more and more aggressive policy actions and easings, and greater and greater strains in the financial market is scary. When Bear Stearns’ creditors were bailed out to the tune of $30 bn in March, the rally in equity, money and credit markets lasted eight weeks; when in July the U.S. Treasury announced legislation to bail out the mortgage giants Fannie and Freddie, the rally lasted four weeks; when the actual $200 billion rescue of these firms was undertaken and their $6 trillion liabilities taken over by the U.S. government, the rally lasted one day, and by the next day the panic had moved to Lehman’s collapse; when AIG was bailed out to the tune of $85 billion, the market did not even rally for a day and instead fell 5%. Next when the $700 billion U.S. rescue package was passed by the U.S. Senate and House, markets fell another 7% in two days as there was no confidence in this flawed plan and the authorities. Next, as authorities in the U.S. and abroad took even more radical policy actions between October 6th and October 9th (payment of interest on reserves, doubling of the liquidity support of banks, extension of credit to the seized corporate sector, guarantees of bank deposits, plans to recapitalize banks, coordinated monetary policy easing, etc.), the stock markets and the credit markets and the money markets fell further and further and at accelerated rates day after day all week, including another 7% fall in U.S. equities today.

    When in markets that are clearly way oversold, even the most radical policy actions don’t provide rallies or relief to market participants. You know that you are one step away from a market crash and a systemic financial sector and corporate sector collapse. A vicious circle of deleveraging, asset collapses, margin calls, and cascading falls in asset prices well below falling fundamentals, and panic is now underway.

    At this point severe damage is done and one cannot rule out a systemic collapse and a global depression. It will take a significant change in leadership of economic policy and very radical, coordinated policy actions among all advanced and emerging market economies to avoid this economic and financial disaster. Urgent and immediate necessary actions that need to be done globally (with some variants across countries depending on the severity of the problem and the overall resources available to the sovereigns) include:

      Another rapid round of policy rate cuts of the order of at least 150 basis points on average globally.

      a temporary blanket guarantee of all deposits while a triage between insolvent financial institutions that need to be shut down and distressed but solvent institutions that need to be partially nationalized with injections of public capital is made;

      a rapid reduction of the debt burden of insolvent households preceded by a temporary freeze on all foreclosures;
      massive and unlimited provision of liquidity to solvent financial institutions;

      public provision of credit to the solvent parts of the corporate sector to avoid a short-term debt refinancing crisis for solvent but illiquid corporations and small businesses;

      a massive direct government fiscal stimulus packages that includes public works, infrastructure spending, unemployment benefits, tax rebates to lower income households and provision of grants to strapped and crunched state and local government;

      a rapid resolution of the banking problems via triage, public recapitalization of financial institutions and reduction of the debt burden of distressed households and borrowers;

      an agreement between lender and creditor countries running current account surpluses and borrowing, and debtor countries running current account deficits to maintain an orderly financing of deficits and a recycling of the surpluses of creditors to avoid a disorderly adjustment of such imbalances.

    At this point anything short of these radical and coordinated actions may lead to a market crash, a global systemic financial meltdown and to a global depression. The time to act is now as all the policy officials of the world are meeting this weekend in Washington at the IMF and World Bank annual meetings.


Related Posts :
  1. Kiener: Gold Prices To Double On Paper Market Default
  2. From Wall Street to Main Street... Credit Frozen
  3. Long Bonds, Short Equities
Please Note!
This is generally never true. Before buying or selling any stock you should do your own research and reach your own conclusion. See my Disclaimer on the bottom for more information.

You are welcome to republish this article, or any portion thereof.
Please, cite the actual/original source. I would be grateful if you could link back.



Stumble Upon Toolbar Add to Technorati Favorites Bookmark and Share

Rate Cut : Conventional Monetary Policy Has Much Traction

From The New York Times Blog : The Trouble With Rate Cuts - by Paul Krugman, Oct 8, 2008, 9:08 am


The coordinated rate cut was the right thing to do. But I don’t expect much from it — because the relationship between Fed funds rates and the rates most businesses actually pay is very weak right now, thanks to the messed-up state of the financial system.

A quick illustration: in early July 2007, before the crisis, the target Fed funds rate was 5.25% and the rate on 30-day A2/P2 commercial paper — that is, CP issued by less-than-sterling borrowers — was 5.4%. On Monday of this week, the target Fed funds rate was 2%, down 325 basis points from pre-crisis levels, but the CP rate was 5.61% — up from pre-crisis levels.

So will this latest rate cut make any difference to borrowers? Maybe — but only to a few of them. We’re way past the point at which conventional monetary policy has much traction.

Related Posts :
  1. 10/9/2008 : Market Panic
  2. Does Morgan Stanley(MS) Need To Raise $30 Billion?
  3. Oct 8, 2008 - Market Wrap
  4. Futures Surge After Global Rate Cut
Please Note!
This is generally never true. Before buying or selling any stock you should do your own research and reach your own conclusion. See my Disclaimer on the bottom for more information.

You are welcome to republish this article, or any portion thereof.
Please, cite the actual/original source. I would be grateful if you could link back.


Stumble Upon Toolbar Add to Technorati Favorites Bookmark and Share

Does Morgan Stanley(MS) Need To Raise $30 Billion?


From ClusterStock : Does Morgan Stanley Need To Raise $30 Billion? (MS), Oct 9, 2008 5:15 pm

John Mack, Morgan Stanley's top guy, is meeting with the executives from Mitsubishi UFJ right now in London. That conversation is probably a bit awkward now that word is spreading Morgan Stanley is probably going to have to massively dilute their stake sometime very soon.

Here's Barron's :
    In its 10-Q filing, the financial services concern admitted that if it can’t access debt markets in the future, it may have to seek to raise capital and funding through a common-share issuance. Wonder what the folks at Mitsubishi UFJ, which is expected to close on a $9 billion investment in the bank on Tuesday, thought about the prospective dilution? Following Thursday’s selloff, Morgan Stanley shares traded at a nearly 50% discount to the $25.25 a share Mitsubishi agreed to pay for its $3 billion purchase of MS equity. According to Egan-Jones Rating, Morgan Stanley - with $1 trillion of assets, but only $16 billion of market valuation - probably needs as much as $30 billion in new capital to address its funding concerns. Every $2 increase in funding costs boosts its costs by $20 billion a year, Egan-Jones added.

Related Posts :
  1. Lehman CDS Settlement Auction Timeline
  2. 10/9/2008 : Market Panic
  3. Tomorrow is That Huge Lehman Derivative Settlement
  4. Did JPM Cash Call Bring Down Lehman ?
Please Note!
This is generally never true. Before buying or selling any stock you should do your own research and reach your own conclusion. See my Disclaimer on the bottom for more information.

You are welcome to republish this article, or any portion thereof.
Please, cite the actual/original source. I would be grateful if you could link back.


Stumble Upon Toolbar Add to Technorati Favorites Bookmark and Share

Trade Deficit and Oil

From Calculated Risk : Trade Deficit and Oil, Oct 9th, 2008 07:06 pm

Something a little different ...

Tomorrow morning the Department of Commerce will release the trade deficit report for August. Some people might be looking at this report to see the impact of falling oil prices and slowing export growth.

It is helpful to remember that oil prices peaked in July, but there is a lag between spot price and import prices. Therefore I expect import oil prices to be a little higher for August than July.

U.S. Oil Prices Click on table for larger image in new window.

This graph, based on data from the EIA, shows the weekly spot prices for oil weighted by import volume.

I expect that the collapse in oil prices will not show up until the September trade deficit report.

Oil prices fell even further today, from the AP: Demand destruction: Oil prices drop to 1-year low.

And export growth may be slowing, but I don't expect to see much evidence in the August report. If we look at container traffic at the Los Angeles area ports, exports were still strong in August.

So the trade deficit tomorrow probably won't show either the impact from falling oil prices or slowing export growth. Just something to remember when we read the news reports.

Related Posts :
  1. Lehman CDS Settlement Auction Timeline
  2. Tomorrow is That Huge Lehman Derivative Settlement
  3. From Wall Street to Main Street... Credit Frozen
Please Note!
This is generally never true. Before buying or selling any stock you should do your own research and reach your own conclusion. See my Disclaimer on the bottom for more information.

You are welcome to republish this article, or any portion thereof.
Please, cite the actual/original source. I would be grateful if you could link back.


Stumble Upon Toolbar Add to Technorati Favorites Bookmark and Share

10/9/2008 : Market Panic

Oct 9th, 2008

Source : Google Finance

From AOL Money & Finance :
    Thursday's sell-off came as Standard & Poor's Ratings Services put General Motors Corp. and its finance affiliate GMAC LLC under review to see if its rating should be cut. The action means there is a 50 percent chance that S&P will lower GM's and GMAC's ratings in the next three months. GM has been struggling with weak car sales in North America.

    It's the worst run for the Dow since the nearly two-year bear market that ended in December 1974 when the Dow lost 45 percent. The S&P 500, meanwhile, is off 655 points, or 41.9 percent, since recording its high of 1,565.15.

    U.S. stock market paper losses totaled $872 billion Thursday and the value of shares over all has tumbled a stunning $8.33 trillion since last year's high. That's based on figures measured by the Dow Jones Wilshire 5000 Composite Index, which tracks 5,000 U.S.-based companies' stocks and represents almost all stocks traded in America.

    S&P also put Ford Motor Co. on credit watch negative. The ratings agency said that GM and Ford have adequate liquidity now, but that could change in 2009.

    GM, one of the 30 stocks that make up the Dow industrials, fell $2.15, or 31 percent, to $4.76, while Ford fell 58 cents, or 22 percent, to $2.08.
Photo by ABC News

From Bloomberg, Oct 9 :
    The government is planning to buy stakes in a wide range of banks within weeks as the credit freeze increasingly threatens to tip the U.S. economy into a deep recession.

    Treasury Secretary Henry Paulson and top aides are still considering options on how the purchases would work, including having the government acquire preferred stock, two officials informed of the matter said.

    A $200 billion to $300 billion figure would probably pay for minority stakes in U.S. banks not on the brink of failure, according to estimates by Duke University finance professor Campbell Harvey in North Carolina.

    As a credit freeze sends rates on loans between banks soaring, the world's biggest economies are stepping up efforts to prevent a financial meltdown. In the U.K., Prime Minister Gordon Brown is engineering a 50 billion pound ($87 billion) program that partly nationalizes at least eight British banks. He's also enacting other measures to help the banking system.

    Paulson and Federal Reserve Chairman Ben S. Bernanke will meet with their counterparts from the Group of Seven major industrial nations tomorrow in Washington.
See the chart below, the Dow has plunged by -1746.19 points (-16.91%) for the fourth straight days this week. While S&P 500 off -189.31 points (-17.22%) and Nasdaq off -302.27 points (-15.52%).

In the last two weeks :
    Dow : -2563.94 (-23%)
    S&P 500 : -303.09 (-24.98%)
    Nasdaq : -538.22 (-24.65%)
In the Black Monday Crash on October 19th, 1987, 21 years ago; The Dow plunged 22% in the intraday trading.


In the next morning, Oct 10th, 2008. Nikkei index down more than 7 percent in early trading.


Related Posts :
  1. Tomorrow is That Huge Lehman Derivative Settlement
  2. List of ETFs by VOLUME
  3. Bear Market of 2000-2003
  4. 1929-32 Rallies
  5. 10/08/2008 Market Recap: Almost a reversal day
Please Note!
This is generally never true. Before buying or selling any stock you should do your own research and reach your own conclusion. See my Disclaimer on the bottom for more information.

You are welcome to republish this article, or any portion thereof.
Please, cite the actual/original source. I would be grateful if you could link back.


Stumble Upon Toolbar Add to Technorati Favorites Bookmark and Share

Lehman CDS Settlement Auction Timeline

From Reuters : Lehman CDS settlement auction timeline, Oct 9, 2008 04:16 pm

NEW YORK, Oct 8 (Reuters) - The value of credit default swaps backed by defaulted Lehman Brothers bonds will be set on Friday, with protection sellers expected to face massive losses of around 90 percent of the insurance they sold.

Bondholders have seen their investments virtually wiped out by Lehman's bankruptcy filing on September 15, with most of the defaulted bonds which will be used to settle the swaps trading in the area of 12-to-13 cents on the dollar, according to MarketAxess.

The auction to settle credit default swaps on this debt will likely be the second-largest settlement of the contracts in the $55 trillion market, following an auction to settle swaps on Fannie Mae and Freddie Mae on Monday.

Twenty-two dealers will participate in the auctions, which will determine how much protection sellers will recover after paying out the insurance. The timeline for the auctions follows, according to JPMorgan.

9:45 a.m.-10 a.m. Auction participants will submit bids and offers for the debt backing the credit default swaps, which will be used to determine the initial recovery rate of the swaps.

10:30 a.m. Auction administrators Creditex and Markit will publish the initial recovery price and the open interest for the contracts will be published. The open interest reflects the amount of bids and offers that have been made, and will show if there are more buyers than sellers, or vice versa.

12:45 p.m. -1 p.m. Participating dealers will submit limit orders for the debt on behalf of themselves and their clients to fill the open interest

2 p.m. The final price of the auction will be published. (Reporting by Karen Brettell; Editing by Chizu Nomiyama)

Related Posts :
  1. Tomorrow is That Huge Lehman Derivative Settlement
  2. 10/9/2008 : Market Panic
  3. Credit Crunch For Sale
  4. Kiener: Gold Prices To Double On Paper Market Default
  5. From Wall Street to Main Street... Credit Frozen
  6. Did JPM Cash Call Bring Down Lehman ?
Please Note!
This is generally never true. Before buying or selling any stock you should do your own research and reach your own conclusion. See my Disclaimer on the bottom for more information.

You are welcome to republish this article, or any portion thereof.
Please, cite the actual/original source. I would be grateful if you could link back.


Stumble Upon Toolbar Add to Technorati Favorites Bookmark and Share

Tomorrow is That Huge Lehman Derivative Settlement

From The Big Picture : Dow 8579, Oct 9, 2008 03:04 pm

WTF just happened?

Okay, our Dow 10,000, 9500 and now our Dow 9,000 targets have been hit.

Where do we go next -- are we close enough to a bottom to buy, or are we heading much lower?

Dow is now off 39% from its highs.

~~~

This cascading waterfall selloff is ugly. Next key level of support is 8750, where we would again be buyers of the market.

If that does not hold, then we are looking at no support until the 2002 levels -- about 7250. (I may have to dust off that Dow 6,800 call).

As we noted earlier, tomorrow is that huge Lehman derivative settlement, and I wonder how much of this action is due to that.


Related Posts :
  1. List of ETFs by VOLUME
  2. Bear Market of 2000-2003
  3. 1929-32 Rallies
  4. 10/08/2008 Market Recap: Almost a reversal day
Please Note!
This is generally never true. Before buying or selling any stock you should do your own research and reach your own conclusion. See my Disclaimer on the bottom for more information.

You are welcome to republish this article, or any portion thereof.
Please, cite the actual/original source. I would be grateful if you could link back.


Stumble Upon Toolbar Add to Technorati Favorites Bookmark and Share

List of ETFs by VOLUME

Here is a list of the biggest trading volume of ETFs :

Name YTD
Return %
1 mo
Return %
3 mo
Return %
Trading
Volume
SPDRs (SPY) -30.90 -19.60 -19.98 189,008,184
PowerShares QQQ (QQQQ) -36.11 -24.80 -27.23 133,912,559
Financial Select Sector SPDR (XLF) -36.82 -17.37 -9.91 112,205,305
iShares Russell 2000 Index (IWM) -25.93 -21.94 -14.87 72,330,361
UltraShort QQQ ProShares (QID) 83.38 46.15 49.56 35,971,631
iShares MSCI Japan Index (EWJ) -30.37 -15.89 -25.06 23,773,925
Energy Select Sector SPDR (XLE) -34.04 -23.91 -37.20 22,188,799
UltraShort S&P500 ProShares (SDS) 65.65 28.08 30.04 21,019,225
iShares MSCI Emerging Markets Index (EEM) -42.64 -23.13 -34.00 17,451,518
Materials Select Sector SPDR (XLB) -33.77 -26.39 -31.16 17,189,303
DIAMONDS Trust, Series 1 (DIA) -27.16 -15.38 -14.96 16,747,543
UltraShort Oil & Gas ProShares (DUG) 43.73 27.33 82.35 14,205,524
Ultra QQQ ProShares (QLD) -59.10 -39.45 -43.03 14,190,853
iShares MSCI Brazil Index (EWZ) -46.64 -33.63 -48.52 14,142,041
Semiconductor HOLDRs (SMH) -30.87 -15.32 -21.81 13,374,200
iShares MSCI Taiwan Index (EWT) -37.39 -19.85 -31.56 12,175,344
Ultra Financials ProShares (UYG) -64.07 -32.50 -24.24 11,006,459
iShares MSCI EAFE Index (EFA) -37.86 -19.47 -28.23 10,528,041
Oil Services HOLDRs (OIH) -38.12 -30.20 -44.63 10,476,100
UltraShort Russell2000 ProShares (TWM) 34.10 34.29 10.68 10,358,310

Source : Morningstar, Oct 8, 2008


Related Posts :
  1. Rimm Bullish Ahead of Christmas
  2. 10/08/2008 Market Recap: Almost a reversal day
  3. Oct 8, 2008 - Market Wrap
Please Note!
This is generally never true. Before buying or selling any stock you should do your own research and reach your own conclusion. See my Disclaimer on the bottom for more information.

You are welcome to republish this article, or any portion thereof.
Please, cite the actual/original source. I would be grateful if you could link back.


Stumble Upon Toolbar Add to Technorati Favorites Bookmark and Share

Rimm Bullish Ahead of Christmas

From Fund My Mutual Fund : Bookkeeping: Restarting Research in Motion (RIMM), Oct 8, 2008 02:52 pm

Looking around I've noticed we had killed off all technology exposure - so trying to think of things that could go well, I want to get something on that side of the ledger. Unfortunately, all my favorite names are also the hedge funds favorite names - the Apples (AAPL), Research in Motions (RIMM), Qualcomms (QCOM) - even Amazon (AMZN). Or Mastercard (MA) which is not a technology stock but along the same line of thought....

So I am sort of tossing a coin on which one to buy, one name is good enough in this market where they are all treated quite the same - unless we know which hedge funds funds blowing up owned each of these, and to what degree they still own it on their books, there is no way to figure out which has the least risk. I still really like Apple here, but decided on Research in Motion. Apple does report in a few weeks so there is upside potential but also downside - but expectations now are so low I could see them saying good things... BUT they always are conservative on guidance - which people have taken literally in the past and panicked. Research in Motion already reported, "disappointed" [Sep 25: Research in Motion Disappoints on Guidance and Misses Quarter], and was taken to the woodshed - down 40% in a few weeks. So there is at least not earnings risk. And all I want is exposure to "NASDAQ" which I could also of done through say Ultra Technology (ROM) - however some of the top holdings in that ETF are not my favorites.

So this is really just a proxy on NASDAQ, but there was the announcement of the launch of 'Storm' today which should help later in the fall. Normally I'd buy both Apple and Research in Motion but in this market, its not about individual fundamentals, just huge sector rotations. (or lately, rotation to nowehere) And with how quick the trading is, the less positions to manage the better.
  • Research In Motion (RIMM) this morning announced that its new touch-screen BlackBerry, the Storm, will start shipping to Verizon (VZ) and Vodafone (VOD) later this fall. The device will be priced in line with the Apple (AAPL) iPhone at $199, and will match Apple’s 8 GB of storage capacity.

  • Canaccord Adam's analyst Peter Misek responded to the news by upping his rating on the stock to Buy from Hold. Misek wrote that “the unveiling of RIM’s highly anticipated touch screen handset should provide some much needed relief to the investor base.” He says the Storm news should boost Street confidence in estimates for the fiscal third quarter ending in November and the fourth quarter ending in February.

  • RBC Capital’s Mike Abramsky, who has a Sector Perform rating on the stock, writes that the Storm has some advantages over the iPhone, including BlackBerry email, a removable battery and a 3.2MP camera capable of shooting video. He notes that RIMM claims its haptic touchscreen technology makes its virtual keyboard better than the one offered by Apple, with better typing accuracy.

  • JMP Securities’ Samuel Wilson repeated his Market Outperform rating and $80 target price. “As the lead holiday season product, distributed for free with contract at Vodafone, we believe this launch will drive a substantial uptick in RIMM sales,” he writes. Wilson says the phone is “designed as ammunition for carriers left out of the iPhone.” Oppenheimer’s Ittai Kidron, who has an Outperform rating on RIMM, asserts that “with strong carrier support this holiday season, we believe the Storm fundamentally changes the game” for RIMM.

  • UBS analyst Maynard Um, who has a Neutral rating on RIMM, writes that the arrival of the Storm should be good for RIMM’s shares, but cautions that he is “keeping an eye out for the BlackBerry Bold launch at AT&T as concerns over further delays linger.”

None of those comments matter one iota in this market since they talk about fundamentals - which have not mattered for a long time. I can't recall the last time I saw Research in Motion around 16x earnings... despite all its ills it is still growing 40%ish. But since the structure of companies mean little, we're only treating it as a trading vehicle as all this market allows. At some point the sellers must get exhausted in this market and liquidations are complete.

I closed the last of our Research in Motion about 1 month ago at $103... today it traded in the low $50s at its worst - amazing. I'm buying a 2.9% stake in the $59s. While I think Christmas will be rotten the last thing to go will be the electronic gadgets...

Conceptually I am bullish here from the standpoint of "it hasn't been this bad since 1932 so we must bottom at least for a while" - that hedge fund liquidation situation is the only bogeyman that does not allow me to be more constructive. If they let up for just 2 weeks it would be nice. I'm also reading "some" measures of credit are finally showing "some" signs of improvement today - if this continues it would lead to a conclusion that the mountains of actions done by authorities are having some effect. At this point, that is all many people want to see... still too early to be trusting of anything lasting though. We'll see. Unfortunately, the market simply overrides any individual company at this point.

Long Research in Motion in fund; no personal position

Related Posts :
  1. Bear Market of 2000-2003
  2. 10/08/2008 Market Recap: Almost a reversal day
  3. Oct 8, 2008 - Market Wrap
Please Note!
This is generally never true. Before buying or selling any stock you should do your own research and reach your own conclusion. See my Disclaimer on the bottom for more information.

You are welcome to republish this article, or any portion thereof.
Please, cite the actual/original source. I would be grateful if you could link back.


Stumble Upon Toolbar Add to Technorati Favorites Bookmark and Share

Bear Market of 2000-2003

From Alphatrends : Bear Market of 2000-2003, Oct 8, 2008 09:51 pm

During the 2000-2003 bear market, the SPY made 9 significant drives lower and 8 recovery rallies. The average decline was 18.85% and the average recovery rally was 17.40% which means the market recovered an average of 73.06% of the prior loss. The speed and magnitude of the rallies in a bear market are quite seductive, but being early is just not worth the losses.

These numbers are just averages, there are always outliers and the current decline is unprecedented at least in my 16 year trading experience. If you are attempting to latch onto a counter trend rally remember that it is a high risk strategy, you must wait for price to confirm a possible turn before getting involved and then manage risk. As we saw today, there were many reasons to think the market would reverse higher, but those reasons were quickly dismissed by the market as prices faded in the last hour. Do not stubbornly hold when the market tells you to sell as it did today, there is always tomorrow to try again if you still have your capital intact.

Notice the DIRECTION of the 200 day (40 week) MA, it did not turn higher until April/May 2003. As long as the 200 DMA is declining all rallies should be expected to fail.


Related Posts :
  1. 1929-32 Rallies
  2. 10/08/2008 Market Recap: Almost a reversal day
  3. Oct 8, 2008 - Market Wrap
Please Note!
This is generally never true. Before buying or selling any stock you should do your own research and reach your own conclusion. See my Disclaimer on the bottom for more information.

You are welcome to republish this article, or any portion thereof.
Please, cite the actual/original source. I would be grateful if you could link back.


Stumble Upon Toolbar Add to Technorati Favorites Bookmark and Share

1929-32 Rallies

From Alphatrends : 1929-32 Rallies, Oct 8, 2008 01:56 pm

Historical perspective of bear market rallies.


Related Posts :
  1. 10/08/2008 Market Recap: Almost a reversal day
  2. Oct 8, 2008 - Market Wrap
  3. Futures Surge After Global Rate Cut
Please Note!
This is generally never true. Before buying or selling any stock you should do your own research and reach your own conclusion. See my Disclaimer on the bottom for more information.

You are welcome to republish this article, or any portion thereof.
Please, cite the actual/original source. I would be grateful if you could link back.


Stumble Upon Toolbar Add to Technorati Favorites Bookmark and Share

10/08/2008 Market Recap: Almost a reversal day

From Cobra's Market View : 10/08/2008 Market Recap: Almost a reversal day, Oct 8, 2008 11:37 am

Today is a bit discouraging because a reversal day was almost there but eventually faded in the selling off. Under this situation, one should keep calm and be patient. However I would like to remind you again that the capital preservation is important. Today is unlikely a bottom according to 2.0.0 Volatility Index (Daily) because the market rarely reaches bottom while VIX is still a big white candle.


What about tomorrow? Now I feel hesitate to say the market is due for a rebound because of being oversold. But there is no straight down market, and I believe a reversal could happen at any time. In most cases the bottom is formed as an intraday reversal, but not always. It is also possible that the reversal day is formed on today and tomorrow. On July 14th there was also a selling off after an intraday reversal, and the market soared up on the next day. Therefore, the history might repeat.

1.0.4 S&P 500 SPDRs (SPY 15 min), 1.1.5 PowerShares QQQ Trust (QQQQ 15 min). Today's selling off can also be considered as the kiss back after the breakout of bullish falling wedge, which supports the possibility of tomorrow's rally.


3.2.0 CurrencyShares Japanese Yen Trust (FXY Daily). Japanese Yen is overbought, and the candle looks like a reversal. The retreat of Japanese Yen helps carry trade and is in turn bullish to the stock market. Although it is said that the influence of carry trade is almost gone, my observation shows that the trend of Yen is nearly an inverse of the stock market. You may refer to the relationship between the intraday trend of Yen and SPY on 2.1.0 S&P 500 SPDRs (SPY 5 min).


3.2.4 Yen RSI and the Market Top/Bottom. When Yen enters into the overbought region, the green curve denotes the stock market is very likely bottomed, isn't it? Today Yen is finally there, which is a good sign.


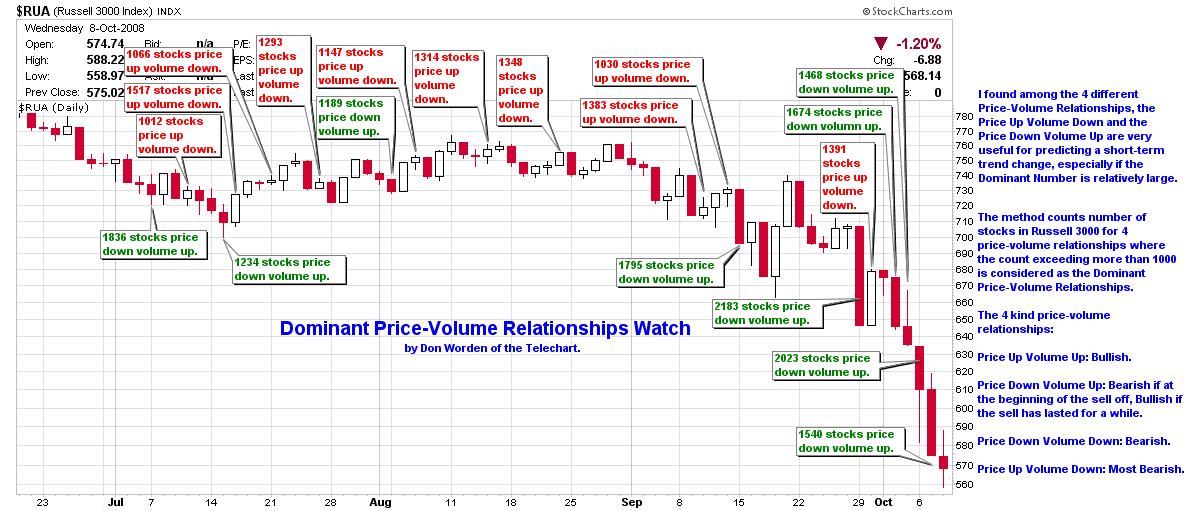
1.3.7 Russell 3000 Dominant Price-Volume Relationships, 1540 stocks price down volume up. Among recent six days, four days the dominant price-volume relationship is price down volume up, which indicates the market is extremely oversold.


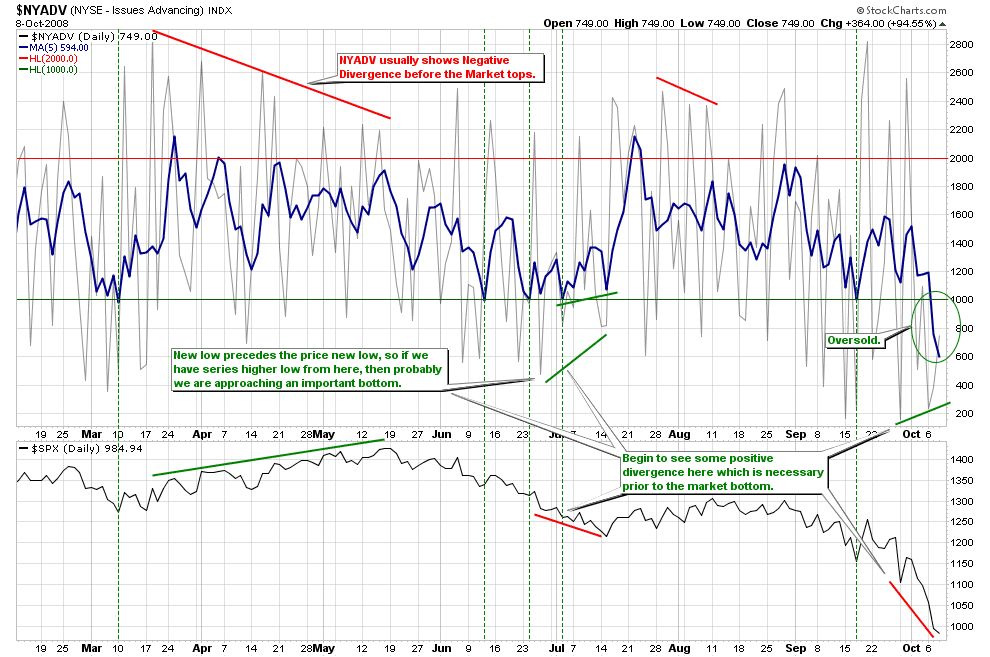
2.4.2 NYSE - Issues Advancing. This is the most encouraging signal today. NYADV is still higher low. As long as no lower low shows up, we have a piece of hope.


Related Posts :
  1. Oct 8, 2008 - Market Wrap
  2. Futures Surge After Global Rate Cut
  3. 10/02/2008 Market Recap: Market Oversold
Please Note!
This is generally never true. Before buying or selling any stock you should do your own research and reach your own conclusion. See my Disclaimer on the bottom for more information.

You are welcome to republish this article, or any portion thereof.
Please, cite the actual/original source. I would be grateful if you could link back.


Stumble Upon Toolbar Add to Technorati Favorites Bookmark and Share

Oct 8, 2008 - Market Wrap

From Bear Mountain Bull : Market Wrap

A pretty messy day, with the indices getting bounced around pretty good - down hard out of the gate, a quick turn back up, and then a reversal-of-the-reversal to head back down to those morning lows before turning back up going into the final hour - where we got a reversal-of-the-reversal-of-the-reversal that sold the Dow off about 300 points in the last 30-40 minutes.

Sigh.

Hey, but the Naz-100 was flat!! And the Transports too!! Ok, small victories. Really small.

Dow Industrials 9258.10 -189.01 -2.00%
S&P 500 984.94 -11.29 -1.13%
Nasdaq Comp. 1740.33 -14.55 -0.83%
Russell 2000 546.57 -12.38 -2.21%
NYSE Comp. 6306.35 -82.03 -1.28%
Nasdaq 100 1330.61 +0.63 +0.05%
Dow Transports 3902.32 +4.17 +0.11%
Dow Utilities 367.59 -9.10 -2.42%

Treasuries were sold off hard, and yields (on the long end) went higher:
    6-month: 1.05%
    2-yr: 1.63%
    5-yr: 2.71%
    10-yr: 3.71%
    30-yr: 4.11%.
Internals were negative - again - but they were better than yesterday, on heavier volume. Advances/declines were 1 to 3 on the NYSE and 5 to 14 on the Nasdaq, with up/down volume near 1 to 2 on both exchanges. How about 4 new highs to 3100 new lows - yikes! New highs/lows were 1/1949 on the NYSE and 3/1164 on the Nasdaq.

There were a few green groups today, the biggest, by far, being the gold and silver stocks (+17.2%), followed byt steel stocks (+3.6%), housing (+1.3%), metals (+1.2%) and oil services (+1.0%). Leading the losers were the brokers (-4.7%), insurance (-4.1%), airlines (-4.0%), HMOs (-3.8%), paper stocks (-3.7%), telecoms (-3.3%) and banks (-2.9%).

Energy prices fell slightly, with crude down to $88.95/barrel, gasoline to $2.04/gallon, and natural gas to $6.74/mmBTU. The dollar index also fell, dropping to 80.50. Gold and silver were higher, with spot gold up to $887/ounce and silver to $11.48/ounce.

BMB Note : You know things are bad when you breathe a sigh of relief that the Dow was down ONLY 189 points…

The market had a chance to try to reverse off the morning lows, but just couldn’t do it with any conviction, and gave it up again into the closing bell. Bonds had a lousy day and pushed yields higher, but it’s too early to say if that’s real meaningful or not - we’ve seen bonds get jostled around before without making any real progress either up or down.

We keep watching and looking, but we just don’t see much good happening at this point - and still no real indications of even a short-term low in place. No sense in letting those shields down - obviously this ’siege’ isn’t over.


Related Posts :

Futures Surge After Global Rate Cut

Please Note!
This is generally never true. Before buying or selling any stock you should do your own research and reach your own conclusion. See my Disclaimer on the bottom for more information.

You are welcome to republish this article, or any portion thereof.
Please, cite the actual/original source. I would be grateful if you could link back.


Stumble Upon Toolbar Add to Technorati Favorites Bookmark and Share

How Bad Is the Federal Reserve's Balance Sheet?

By James Hamilton : How Bad Is the Federal Reserve's Balance Sheet?, Oct 8, 2008


I was astonished when I heard that the Fed is contemplating increasing the Term Auction Facility to $900 billion. I wanted to take another look at the ever-changing balance sheet of the Fed to see how logistically Bernanke might be able to perform such a feat.

The one power that the Fed unquestionably possesses is the ability to create money. It traditionally did so by buying Treasury securities from the public, crediting the sellers' banks with newly created Federal Reserve deposits (a "liability" from the Fed's point of view), and adding the securities purchased to the Fed's asset holdings. Those newly created Federal Reserve deposits are essentially electronic credits that the banks could use to receive delivery of green cash from the Federal Reserve.

The first column of the table below provides a condensed version of the Federal Reserve's balance sheet in the halcyon moments before the credit turmoil began in August 2007. By far the most important asset held by the Fed at that time was some $800 billion in Treasury securities, largely balanced on the liabilities side by a similar value for currency in circulation. Repurchase agreements at that time were used by the Fed as a vehicle to add reserves temporarily, while reverse repos entered on the liabilities side as a factor temporarily draining reserves. The residual reserve balances, after adding up all the factors supplying reserves and subtracting all the other factors absorbing reserves, were themselves a tiny number, under $7 billion.


Balance sheet of the Federal Reserve.
(Based on end-of-week values, in billions of dollars).
Data source: Federal Reserve Release H.4.1.

Banks
Aug 8 2007
Sept 3 2008
Oct 1 2008
Securities
790,820
479,726
491,121
Repos
18,750
190,000
83,000
Loans
255
19,089
49,566

Discount Window


150,000
149,000

TAF


146,565

PDCF


152,108

AMLF


61,283

Other Credit


29,287
29,447

Maiden Lane

41,957
100,524
320,499
Miscellaneous
51,210
51,681
50,539
Factors Suppliying Reserve Funds
902,992
939,307
1,533,128
Currency in Ciscullation
814,626
836,836
841,003
Reverse Repos
30,131
41,756
93,063
Treasury Supplement


388,850
Other
51,440
56,884
38,717
Reserve Balances
6,794
3,831
171,495
Factors Absorbing Reserve Funds
902,992
939,307
1,533,128


The Fed's actions since August of 2007 have often been described as providing "liquidity", though they were not doing so in the traditional sense of expanding reserves or the money supply. We see in the second column of the table above that the increase in currency in circulation between August 2007 and September 2008 was in fact quite modest, and reserve balances actually fell over that period.


The Fed did provide enough money creation to bring the fed funds rate, the interest rate at which banks lend those reserves to one another overnight, down from 5.25% in the summer of 2007 to 2.0% today. But a number of other interest rates, such as the rate banks lend to one another for a 3-month period, stayed well above that 2% overnight rate, signaling substantial frictions in the interbank market.

To try to address those frictions, the Fed had been significantly changing the composition of the asset side of its balance sheet through the beginning of September 2008, while keeping the total assets essentially constant. These compositional changes included selling off $90 billion in Treasuries and replacing them with repos. This swap was implemented not because the Fed wanted the operations to be short-term, but because it was one device to make a market for the less liquid securities that the Fed accepted as collateral against the repo loans and a device for providing term loans to banks directly.

Borrowing from the Fed discount window increased another $20 billion. The Fed introduced the Term Auction Facility in order to lend an additional $150 billion short-term, serving the same dual objectives of the repos. Maiden Lane LLC was created as a device for handling the $30 billion loan that was part of the Bear Stearns deal. All of these operations by themselves would have increased the money supply and the Fed's total assets. To prevent that from happening, the Fed sold off a comparable volume of its holdings of Treasury securities. By the beginning of September 2008, the Fed had replaced more than $300 billion of its holdings of Treasury securities with assorted riskier loans.

But the real action began last month. As reported in the third column of the table above, the Fed expanded its total asset holdings by $600 billion over the last 30 days, with less than a third of this going directly into reserve balances. The graph below puts the latter magnitude in perspective. When the World Trade Center towers burned down on September 11, 2001 many of the financial institutions that played a key role in trades of government securities and interbank loans were wiped out or incapacitated, posing potentially huge liquidity problems. Reserves ballooned to $67 billion, as excess reserves simply piled up in some banks while others remained in need. Last week's spike of $171 billion was 2-1/2 times as big-- the breakdown of interbank lending last week proved more profound than that caused by the physical disruptions in New York in 2001.


Reserve Balances with Federal Reserve Banks (weekly, not seasonally adjusted, in billions of dollars).
Source: FRED.


Anyone who suggests that last week's ballooning reserve deposits represent inflationary pressure or the Fed monetizing the deficit simply doesn't know what they're talking about. Banks are sitting on the reserves, not withdrawing them as cash. When markets settle down, the Fed can and will absorb those reserves back in with sterilizing sales of Treasury securities, just as it did in 2001 or after the more modest spike in August 2007. Providing new reserves aggressively is absolutely and unquestionably the way the Fed needs to respond to this kind of development.

But referring back to the original table, we see that creating new reserves, as dramatic as it was, was dwarfed in magnitude by some of the other actions the Fed took over the last month. The Fed is now lending out an additional $150 billion in its primary dealer credit facility, providing overnight loans to primary security dealers who could not borrow directly from the Fed's discount window. Again this lending seems very much in the spirit of addressing the immediate liquidity needs, defined narrowly in terms of stressed overnight lending markets.

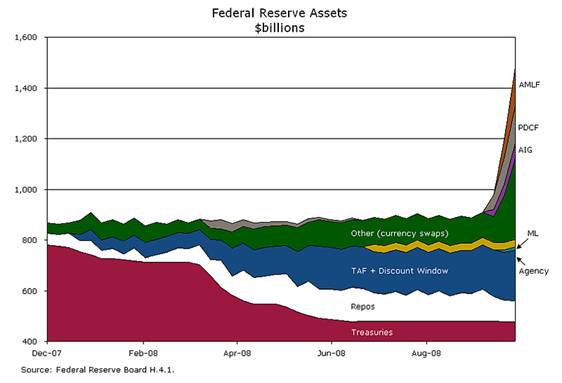
Then there's another $150 B for the AMLF-- the Asset-Backed Commercial Paper Money Market Mutual Fund Liquidity Facility, or the Name Too Long Even to Acronymize, $61 B for "other credit extensions" (primarily the AIG deal) and close to a new $300 billion over the last year in "other Federal Reserve assets", in which currency swaps are probably the biggest single item. A hundred billion here, and a hundred billion there, and pretty soon you're talking about real money. Macroblog has a nice visual of how these goodies all add up:

Federal Reserve assets in billions of dollars. Source: Macroblog.

But how did the Fed acquire all that stuff, with "only" a $160 B increase in reserve balances and a $30 B increase in currency outstanding? The answer is to be found in a new entry on the liability side described as "Treasury supplementary financing account." This was announced by the U.S. Treasury through the following somewhat obscure release:
    The Federal Reserve has announced a series of lending and liquidity initiatives during the past several quarters intended to address heightened liquidity pressures in the financial market, including enhancing its liquidity facilities this week. To manage the balance sheet impact of these efforts, the Federal Reserve has taken a number of actions, including redeeming and selling securities from the System Open Market Account portfolio.

    The Treasury Department announced today the initiation of a temporary Supplementary Financing Program at the request of the Federal Reserve. The program will consist of a series of Treasury bills, apart from Treasury's current borrowing program, which will provide cash for use in the Federal Reserve initiatives.

    Announcements of and participation in auctions conducted under the Supplementary Financing Program will be governed by existing Treasury auction rules. Treasury will provide as much advance notification as possible regarding the timing, size, and maturity of any bills auctioned for Supplementary Financing Program purposes.


Here's what I take that to mean. I gather that the Treasury auctioned off some extra T-bills to the public, in addition to their usual weekly auction, and simply kept the receipts as deposits in an account with the Fed. If that were the end of the story and the Fed kept its total liabilities constant, it would result in a huge (completely infeasible technically) drain on reserve balances and currency in circulation, as banks sought to deliver reserves to the Treasury's account to honor their customers' purchases of the T-bills.

So the Fed offset the supplemental Treasury auction with a matching purchase of private assets, such as the PDCF and AMLF, thereby temporarily delivering reserves to banks which the banks in turn could hand over to the Treasury supplementary account. The net result of such dual Treasury/Fed operations is that the newly created "reserves" would just sit there in the Treasury supplementary account doing nothing other than standing as an accounting entry. In other words, the device allowed for a huge expansion of the Fed's balance sheet without causing any change in currency in circulation or reserve deposits.

Which leaves Bernanke's gun cocked and reloaded, and he's ready to keep shooting. And so the Fed announced on Monday that it's up, up and away for the term auction facility:
    The sizes of both 28-day and 84-day Term Auction Facility (TAF) auctions will be boosted to $150 billion each, effective with the 84-day auction to be conducted Monday. These increases will eventually bring the amounts outstanding under the regular TAF program to $600 billion. In addition, the sizes of the two forward TAF auctions to be conducted in November to extend credit over year end have been increased to $150 billion each, so that $900 billion of TAF credit will potentially be outstanding over year end.

But those Monday developments are ancient history now, because on Tuesday we got a brand new acronym:
    The Federal Reserve Board on Tuesday announced the creation of the Commercial Paper Funding Facility (CPFF), a facility that will complement the Federal Reserve's existing credit facilities to help provide liquidity to term funding markets. The CPFF will provide a liquidity backstop to U.S. issuers of commercial paper through a special purpose vehicle (SPV) that will purchase three-month unsecured and asset-backed commercial paper directly from eligible issuers. The Federal Reserve will provide financing to the SPV under the CPFF and will be secured by all of the assets of the SPV and, in the case of commercial paper that is not asset-backed commercial paper, by the retention of up-front fees paid by the issuers or by other forms of security acceptable to the Federal Reserve in consultation with market participants. The Treasury believes this facility is necessary to prevent substantial disruptions to the financial markets and the economy and will make a special deposit at the Federal Reserve Bank of New York in support of this facility.


I had 4 calls yesterday from reporters, all asking the same question: Will it work?

I wish I knew the answer. I bet Bernanke wishes he knew, too.


Related Posts :
  1. Federal Reserve Bank Credit Balance Swells
  2. Corporate Debt Spreads Continue Spike
Please Note!
This is generally never true. Before buying or selling any stock you should do your own research and reach your own conclusion. See my Disclaimer on the bottom for more information.

You are welcome to republish this article, or any portion thereof.
Please, cite the actual/original source. I would be grateful if you could link back.


Stumble Upon Toolbar Add to Technorati Favorites Bookmark and Share