Translate this page from English into :

Tuesday, October 21, 2008

Will the Fed follow Canada to reduction the interest rate below market expectation?

From Kathy Lien:
    The Bank of Canada cut interest rates by 25bp to 2.25%. This move was smaller than the market expected but still represents 75bp of easing since the beginning of the month.

    With the Federal Reserve set to reduce interest rates next week, Canada’s explanation for the smaller could shed some light on what the Fed may be thinking.

    According to the BoC statement, Canada opted for only a 25bp rate cut for 3 reasons:

    1. They have already cut interest rates aggressively this month
    2. Even though they believe further easing will be necessary, they want to save their ammunition for the coming months when times will get tough
    3. The recent weakness of the Canadian dollar has offset the drop in commodity prices and softer global demand

    Going into the Federal Reserve’s monetary policy meeting on October 29, the market has priced in a 68 percent change of a 50bp rate cut and a 32 percent chance of a 25bp cut. However like Canada, the Fed has already cut interest rates aggressively this month and it may serve them well to be conservative with monetary easing now to leave themselves room for further easing later. With the massive amount of liquidity and fiscal stimulus that has already been announced, it may not be necessary for the Fed to go all in right now. The US economy will continue to weaken and more rate cuts beyond the move next week will be necessary.

    How does Canada differ from the US?

    If you caught my report on GFT Forex on Monday, I actually laid out the reasons why Canada could cut by 25bp instead of 50bp. The main reason was the improvement in Canadian economic data. The latest reports from the labor market and the manufacturing sector (IVEY PMI) was strong, reducing the BoC’s urgency to show all of their cards.

    The US economy on the other hand is in worse shape. Nearly all economic data from the manufacturing sector to the labor market confirms the weakness of the US economy. Therefore from an economic standpoint, the Fed is dealing with a deeper slowdown than Canada. A 50bp rate cut is still possible if they choose to be proactive.

Related Posts :
  1. US stocks opened lower, Canada tumbled 3%, Bank of Canada cuts key rate by 25bp
  2. Nouriel Roubini: How to prevent contagion effects of the financial crisis in Hungary
  3. $365 bln of Lehman CDS is going to be settled tomorrow
  4. Iceland receives $6 bln rescue package
Sources :
Please Note!
This is generally never true. Before buying or selling any stock you should do your own research and reach your own conclusion. See my Disclaimer on the bottom for more information.

You are welcome to republish this article, or any portion thereof.
Please, cite the actual/original source. I would be grateful if you could link back.



Stumble Upon Toolbar Add to Technorati Favorites Bookmark and Share

Nouriel Roubini: How to prevent contagion effects of the financial crisis in Hungary

By Nouriel Roubini, October 21, 2008

I recently spent a few days visiting Hungary, a country that is now at the center of financial pressures in emerging markets. In recent weeks the stock market has sharply fallen, interest rates have increased, the currency has weakened and financial institutions have suffered of shortages of liquidity. A fully fledged currency and financial crisis can still be avoided with appropriate and coherent policy actions but the financial pressures have intensified in the last week.

The macro, financial and policy weaknesses of Hungary – in many ways similar to those of many other countries in the Emerging Europe region – are not new; here at RGE we covered them as early as June 2006 in two analyses about vulnerabilities in Hungary and in Emerging Europe. But the global financial crisis has been the external trigger that has led now to a liquidity and credit crunch, the risk of a sudden stop and of a reversal of capital inflows.

The vulnerabilities of the economy include a large current account deficit, a still excessive fiscal deficit, a partially overvalued currency, serious maturity and currency mismatches in the financial system, the household sector and the corporate sector, low stock of foreign reserve and high level of short term foreign currency debt that is at risk of a roll-off. Mary Stokes, RGE’s analyst on Emerging Europe, has recently well analyzed and summarized these vulnerabilities:
    Hungary is the latest hotspot in the ongoing global financial turmoil. On October 15, the currency plunged almost 7%, the biggest daily decline in five years and stocks tumbled almost 12%. Meanwhile, demand for Hungary’s government bonds dried up.

    This turmoil comes at a time when Hungary is in recovery mode. In mid-2006, after years of extremely loose fiscal policy that resulted in major imbalances, Hungary implemented a fiscal austerity package, which improved the current account and pushed down the budget deficit (from a record 9.2% of GDP in 2006 to a projected 3.4% of GDP or lower this year).

    So how did Hungary become the latest target in the global financial turmoil?

    While the immediate trigger seems to be a liquidity squeeze prompted by the global financial turmoil, the country has a number of vulnerabilities that contributed to the recent Hungarian asset sell-off.

    High Foreign Currency Lending

    Foreign currency lending in Hungary has increased by leaps and bounds in recent years as shown in the graph below. While swiss franc and euro loans appeal to companies and households because of their lower interest rates, this type of lending is particularly risky because it leaves unhedged borrowers exposed to currency swings.

    Domestic Banks: Heavy Reliance On Non-Deposit, Foreign Financing

    While the rapid growth in foreign currency lending in Hungary is concerning, some of Hungary’s regional peers have similarly high levels. A key problem specific to Hungary is an exceptionally high ratio of foreign currency loans to foreign currency deposits.

    Over 60% of total loans to businesses and households were in foreign currencies (primarily euro, Swiss franc), while foreign currency deposits accounted for just over 20% of total deposits, according to a Fitch report from January 2008. This, combined with Hungary’s high loan-to-deposit ratio of over 140%, suggests a heavy reliance on non-deposit foreign funding, which tends to be volatile especially in the context of the current global credit crunch.

    Domestic Banks: Deteriorating Maturity Structure

    According to a recent report from Hungary’s central bank, the maturity profile of foreign funding has deteriorated and the domestic banking sector must be prepared to face ‘sustained tight liquidity conditions.’ This deterioration in the maturity profile increases ‘roll-over risk’ – the risk that investors are unwilling to refinance the debt coming due – and is a common feature of financial crises.

    Potential Spillover From Foreign Parent Banks

    In a blog post back in April, I noted that the CEE area is clearly vulnerable to any financing issues experienced by the major foreign parent banks that dominate the region’s banking systems. That is, problems in the EU banking sector could potentially impact Hungary and other Eastern European economies and vice-versa. Given the growing concerns about the stability of the EU banking sector, this potential contagion channel is a vulnerability and important to watch. (See related spotlight issue: How Safe Is the EU Banking Sector? Watch High Leverage Ratios and Derivatives Exposure) (See this UniCredit report for details on which foreign banks operate in Hungary.)

    Adverse Financing Composition Of Current Account Deficit

    Hungary’s current account deficit is high, but nothing compared to the double-digit deficits in Bulgaria, Romania, and the Baltics. The key issue is its financing composition.

    In 2007, Hungary’s current account corrected to 5% of GDP, down from 6.1% in 2006, and the gap is projected to be even lower this year. The problem is that net FDI covered just 20% of the gap in 2007, and debt-generating inflows financed the rest, according to Pasquale Diana of Morgan Stanley, who expects some improvement this year.

    Reserves Coverage of Short-term Debt

    Hungary’s short-term debt (18% of GDP) is roughly covered by net international reserves, according to the IMF. The build-up of short-term debt was a key vulnerability in the run-up to the Asian financial crisis in 1997 and the Russia crisis in 1998, among others. Hungary’s foreign exchange reserves totaled EUR17 billion at end-September (less than 3 months of imports, which is normally considered a critical level for FX reserves in terms of liquidity).

    Budget Deficit and Government Debt Levels Highest in the Region

    Notably, Hungary still suffers from twin deficits - the current account deficit mentioned above, as well as a budget deficit. Despite Hungary’s fiscal austerity measures, Willem Buiter still described Hungary as being in a 'deep fiscal mess' earlier this year. With public debt standing around 65% of GDP, Hungary is an outlier among its regional peers. Buiter says the public debt load will turn out to be unsustainable unless there is a major change in the political equilibrium.

    Political Risk

    As Edward Hugh notes in a recent blog post, there is considerable political risk in Hungary. The ruling Socialist Party now governs from a minority position after the Free Democrats pulled out of coalition in April 2008. Meanwhile, the government has become unpopular in the wake of the 2006 fiscal austerity package, making it difficult for the government to pursue a reform agenda

    Growth Laggard

    Hungary's growth is lowest of any CEE country. Real GDP growth of 1.3% in 2007 was down from over 4.0% a year earlier, largely due to the fiscal austerity measures implemented in 2006.
However, at this point the crucial issue - beyond dissecting the macro, policy and financial vulnerabilities that have led to the recent financial pressures – is to figure out what are the possible policy actions that may restore confidence and prevent and currency and financial crisis. Such a crisis would be devastating not only for Hungary but also for the Emerging Europe region: if Hungary goes bust the risk of a domino effect – like the one that in 1997 led the East Asian crisis to spread from Thailand to Malaysia, Indonesia and Korea – would be significant as many of the Emerging Europe region economies share the same vulnerabilities as Hungary (and indeed significant financial pressures are already underway in Estonia, Latvia, Poland, Romania, Bulgaria and Turkey). A crisis in Hungary would lead to a crisis in a large part of Emerging Europe; so preventing such a crisis in Hungary is essential to prevent a broader regional financial crisis.

So what can be done to prevent such a crisis? There are several options on the table that, together, can lead to a coherent policy response that restores confidence and credibility. Let us discuss next in some detail such options…


Related Posts :
  1. The Full Nouriel Roubini Horror Speech
  2. George Soros: Global Capital Meltdown
  3. Roubini Warns of Possible Systemic Meltdown, "Severe Global Depression"
  4. Soros : Paulson's Financial-Rescue Plan Is `Ill-Conceived'
  5. Warren Buffett: We Have "Terrible, Terrible Problems"
Sources :
Please Note!
This is generally never true. Before buying or selling any stock you should do your own research and reach your own conclusion. See my Disclaimer on the bottom for more information.

You are welcome to republish this article, or any portion thereof.
Please, cite the actual/original source. I would be grateful if you could link back.


Stumble Upon Toolbar Add to Technorati Favorites Bookmark and Share

The gold price during recessions

From Tim Iacono:
    Someone recently wrote in a dismissive, almost pompous, tone something to the effect of, "Everyone knows gold doesn't do well in recessions". But, is that true? Well, it depends...

    Click to enlarge


    The author - whoever it was and whatever exactly it was that they wrote - could have done just a little research and quickly found an answer to the question they probably never really wanted an answer to, confident that what they felt in their gut was correct.

    This is common amongst financial writers who believe that history began in 1982.

    So, what do gold price movements during recessions depend on?

    As shown above, the gold price has moved up and down during recessions, the important distinction between the two being that the direction has been decidedly UP during commodity bull markets and DOWN during commodity bear markets.

    Over the last thirty-some years, since the price of gold was allowed to seek a market value, there have been two commodity bull markets, the first ending around 1980 or 1981 and the second beginning around the turn of the century. In recessions during both of those periods, the price of gold has risen.

    During the long commodity bear market, from 1981 to 2000, recessions resulted in a lower gold price.

    The chart above shows price changes during the NBER defined recessions as well as an expanded time period (six months on either side) which serves to reinforce the point made by using the standard definition.

    Save for the 1980 transition period, the data seems to be pretty clear.

    Where does that leave us today?

    If the 1974-1975 period offers a good model for the current period - a pause during the middle of a 12-18 year run which is typical for these cycles - then gold investors have nothing to fear. Regardless of when the current recession officially began and when it ends, the gold price is likely to move higher.

    If, on the other hand, the summer plunge in the natural resource sector is a 1980-like event, where prices for both gold and crude oil made multi-decade highs, then that's an entirely different matter.

    For anyone who has looked closely at the question, it should be clear that the more valid comparison is the former and not the latter.

Related Posts :
  1. 10/21/2008 - Upgrade & Downgrade
  2. Potential Inverse H&S Bottom on Gold (GLD)
  3. Commodities are in a secular bull market
Sources :
Please Note!
This is generally never true. Before buying or selling any stock you should do your own research and reach your own conclusion. See my Disclaimer on the bottom for more information.

You are welcome to republish this article, or any portion thereof, as long as you state that http://conquerthewallstreet.blogspot.com is the source for the article. You must also include a link to our website if you republish the article online.


Stumble Upon Toolbar Add to Technorati Favorites Bookmark and Share

10/21/2008 - Upgrade & Downgrade

Citigroup (C), Morgan Stanley (MS)

Goldman Sachs reinstates coverage on Citi at sell, says buy Morgan Stanley

Goldman Sachs analyst William Tanona reinstated Citigroup (C) at sell and added the stock to Goldman's Americas Conviction Sell List with an $11 six-month price target. He believes it will be difficult for Citi to generate profitability over the next 12 months as additional write-downs, lower levels of capital markets activity, and further deterioration in credit quality trends will continue to weigh on its operating results and capital ratios. He notes Citi trades at 2.3x tangible book value (before the start of trading Oct. 21), well above the 1.5x peer group median, and Morgan Stanley's (MS) multiple of 0.7x. He reinitiated his buy Morgan Stanley/sell Citi pair trade to take advantage of the valuation discrepancies.

Coach Inc. (COH)

Lazard upgrades to buy from hold

Coach (COH) posted higher first-quarter results. Lazard analyst Todd Slater says, recognizing that trends are likely to decelerate against a weakening economic backdrop, he thinks Coach stock is oversold. Slater notes while he's cutting his fiscal 2009 (June) EPS estimate to $2.15 from $2.27, and his fiscal 2010 forecast to $2.15 from $2.46, he's upgrading Coach on his view that the stock is discounting numbers below his worst-case scenario of $1.80 in 2010, an estimate that assumes same-store sales down 12% and $800 million in buybacks over the next 24 months. He notes Coach's 44 cents first-quarter EPS was largely in line with Wall Street estimates and company guidance. He has a $26 price target on the shares.

Texas Instruments (TXN)

Needham cuts estimates, price target

Texas Instruments (TXN) posted lower third-quarter results. Needham analyst N. Quinn Bolton says TI's results missed estimates on lower wireless revenue and deteriorating gross margins; the company significantly reduced its fourth-quarter view on worsening macro headwinds, a less-than-seasonal Christmas holiday, and gross margin pressure. Bolton cut his 42 cents fourth quarter EPS estimate to 33 cents, his $1.79 2008 forecast to $1.69, his $1.70 2009 projection to $1.35; he also cut his $25.50 price target to $20. Despite the company's disappointing guidance, Bolton is positive on TI's plan to sell its low-margin, merchant baseband business and focus on its OMAP processor and custom baseband segments. Bolton kept his buy rating on the shares.

Related Posts :
  1. 10/20/2008 - Upgrade & Downgrade
  2. Commodities are in a secular bull market
  3. Potential Inverse H&S Bottom on Gold (GLD)
  4. SUN Microsystems is expected will report 3rd quarter loss
  5. 10/20/2008 - Long & Short Ideas for Tuesday
Sources :
Please Note!
This is generally never true. Before buying or selling any stock you should do your own research and reach your own conclusion. See my Disclaimer on the bottom for more information.

You are welcome to republish this article, or any portion thereof.
Please, cite the actual/original source. I would be grateful if you could link back.


Stumble Upon Toolbar Add to Technorati Favorites Bookmark and Share

Commodities are in a secular bull market


I summarize an article from Fleet Street Invest:

Commodities are in a secular bull market. It means that it’s a long-term bull trend — one that could last up to 25 years. Currently, we’re about seven years into it — and we’re seeing a perfectly normal correction, after prices ran away to the upside. Forced selling of profitable commodities positions to finance the mess in other sectors has dragged the sector down.

The sell-off that we have seen in commodities like oil, gold, silver and so on certainly show the characteristics of a bear market. Oil has fallen some 47% since the $147 peak. Gold and silver have dropped 22% and 51% since their March peaks. These are bear market performances.

But here’s the thing. Secular market trends are made up of multiple sequential primary trends — some bullish, some bearish. As with any market, they zig and they zag.

In a secular bull market the ‘primary’ bear markets are historically shorter and less damaging than the ‘primary’ bull markets were rewarding. Typically, the primary bear market is not deep enough to totally eradicate the inflation adjusted gains of the previous primary bull markets. Similarly, the succeeding bull markets typically make up for the losses of any previous bear markets.

So the recent sell-off in the commodities could just be a bearish zag, caused by forced selling, following the preceding bullish zig. And I believe that the next primary bull market will take out the previous highs and drive the secular bull market on.

Legendary commodities investor, Jim Rogers says: "We have had 8-9 periods of forced liquidation over the past 100-150 years wherein everything was liquidated without regard to fundamentals. This is such a period."

Rogers believes that the current global economic meltdown will make the commodities bull market last longer. It’s currently being hit by the prospects of slowing growth in emerging economies such as China and India. But, this will ultimately affect supply and that in turn will cause prices to move higher.

"The cyclical demand for commodities may slow, but the secular supply will be badly affected so the commodity bull market will last longer and go further in the end," Rogers says.

Related Posts :
  1. Potential Inverse H&S Bottom on Gold (GLD)
  2. Refiners Finally Increase Margins
  3. 10/20/2008 - As Oil heading toward $50, Buy DUG
  4. The Inventory of The SPDR Gold Shares ETF (GLD) Hit A New All-Time High
  5. Gold’s Tight Supply, Soaring Demand Could Keep ETFs Looking Sharp
Source :
Please Note!
This is generally never true. Before buying or selling any stock you should do your own research and reach your own conclusion. See my Disclaimer on the bottom for more information.

You are welcome to republish this article, or any portion thereof.
Please, cite the actual/original source. I would be grateful if you could link back.


Stumble Upon Toolbar Add to Technorati Favorites Bookmark and Share

Potential Inverse H&S Bottom on Gold (GLD)

From Jesse's Café Américain:
    We have been watching this form up for some time.

    The targets for a breakout are on the chart.

    It works when we hold the lows and breakout over the neckline and stick it on a daily chart. Since much of the gold action is the inverse of the US dollar which is benefiting from a short term squeeze we think the targets may be conservative as the shorts scramble for scarce supply to cover.

    The wild cards are the central bank market meddling and a potential 8-10% downdraft in equities which tends to foster liquidation selling of most assets.

    Click to enlarge


Related Posts :
  1. $365 bln of Lehman CDS is going to be settled tomorrow
  2. Iceland receives $6 bln rescue package
  3. The Inventory of The SPDR Gold Shares ETF (GLD) Hit A New All-Time High
  4. Gold’s Tight Supply, Soaring Demand Could Keep ETFs Looking Sharp
Sources :
Please Note!
This is generally never true. Before buying or selling any stock you should do your own research and reach your own conclusion. See my Disclaimer on the bottom for more information.

You are welcome to republish this article, or any portion thereof.
Please, cite the actual/original source. I would be grateful if you could link back.


Stumble Upon Toolbar Add to Technorati Favorites Bookmark and Share

US stocks opened lower, Canada tumbled 3%, Bank of Canada cuts key rate by 25bp

Two men watch the stock numbers in Toronto's financial district.(Tyler Anderson/National Post)

The Toronto Stock Exchange's main index fell hard at the open on Tuesday as easing commodity prices put pressure on resource issues and profit-taking took hold after two consecutive days of strong gains.

The S&P/TSX composite index was down 331.3 at 9,920.1 shortly after opening, with all but one of its 10 main groups lower.

Bank of Canada Governor Mark Carney. The Bank of Canada announced its latest interest rate policy decision on Tuesday. (Chris Wattie/Reuters)

The Bank of Canada cut its benchmark-lending rate Tuesday by a quarter point, citing an "uncertain" outlook for growth and inflation that poses "significant risks" to the economy. Furthermore, it indicated that another reduction "will likely" be in the offing. As a result of Tuesday's move, the Bank of Canada overnight rate stands at 2.25%.

Specialist Michael Sollitto, right, directs trades in J.P. Morgan on the floor of the New York Stock Exchange Monday, Oct. 20, 2008. Wall Street surged on a burst of optimism Monday, propelling the Dow Jones industrials up more than 400 points on more signs of a reviving credit market and comments from Federal Reserve Chairman Ben Bernanke. (AP Photo/Richard Drew)

In the first hour of trading, the Dow fell 15.05, or 0.16 percent, to 9,250.38 after falling more than 100 but also bobbing into positive territory. Broader indexes were also lower. The Standard & Poor's 500 index fell 2.54, or 0.26 percent, to 982.86. The Nasdaq composite index shed 4.26, or 0.24 percent, to 1,765.77.

On Monday, markets spiked on more signs of a reviving credit market and support from Federal Reserve Chairman Ben Bernanke for further steps to aid the economy, including an additional stimulus package.


Related Posts :
  1. 10/20/2008 Market Recap - Positive Signs in Credit Market
  2. $365 bln of Lehman CDS is going to be settled tomorrow
  3. Iceland receives $6 bln rescue package
Sources :
  1. The Financial Post: Bank of Canada cuts key rate, October 21, 2008
  2. The Financial Post: Toronto stocks tumbles 3% on opening, October 21, 2008
  3. Boston.com: Stocks open lower after previous session's rally, October 21, 2008
Please Note!
This is generally never true. Before buying or selling any stock you should do your own research and reach your own conclusion. See my Disclaimer on the bottom for more information.

You are welcome to republish this article, or any portion thereof.
Please, cite the actual/original source. I would be grateful if you could link back.


Stumble Upon Toolbar Add to Technorati Favorites Bookmark and Share

Refiners Finally Increase Margins

From Bespoke Investment Group:
    One of the few groups in the energy sector that didn't benefit from the huge runup in oil in the first half of 2008 was the refiners. As oil prices spiked, the refiners were unable to pass those same price increases on to the consumer. This squeezed margins, and earnings estimates (along with share prices) dropped significantly. This is why prices at the pump didn't double from $3/gallon to $6/gallon when oil doubled from $70 to $140.

    Now, on the other hand, oil prices have declined from $140 to $70, but prices at the pump haven't been cut in half. This means the refiners are finally seeing an increase in their margins, and as shown in the chart below, earnings estimates for Valero (a key refiner) have spiked up quite a bit over the past two months. VLO's stock price has not spiked up over the past few months, however, so there may be an opportunity there.


Related Posts :
  1. 10/20/2008 - Upgrade & Downgrade
  2. 10/20/2008 - Long & Short Ideas for Tuesday
  3. 10/20/2008 - As Oil heading toward $50, Buy DUG
Sources :
Please Note!
This is generally never true. Before buying or selling any stock you should do your own research and reach your own conclusion. See my Disclaimer on the bottom for more information.

You are welcome to republish this article, or any portion thereof.
Please, cite the actual/original source. I would be grateful if you could link back.


Stumble Upon Toolbar Add to Technorati Favorites Bookmark and Share

SUN Microsystems is expected will report 3rd quarter loss

Photo courtesy of Flickr

Sun Microsystems (JAVA), the computer server maker, said Monday it expected to post a loss of 25 to 35 cents a share and a decline in sales for its most recent quarter and might have to take a charge related to a recent acquisition. For years, Wall Street customers have accounted for a large portion of Sun’s sales. With many of these customers disappearing while others have pulled back on technology spending, Sun has found itself in a difficult position, trying to move the newest models of hardware and software. Sun competes against companies like I.B.M. (IBM), Hewlett-Packard (HPQ) and Dell (DELL) in the server business.

The company, which plans to release full results on October 30. Sun said it expected to post revenue of $2.95 billion to $3.05 billion for the period, its first fiscal quarter, which ended Sept. 28. That is down from $3.22 billion a year earlier. Analysts had forecast revenue for the most recent quarter of $3.15 billion. Last November, Sun performed a one-for-four reverse stock split that pushed shares above $20. Since that time, Sun’s stock has been battered, closing Monday at $5.78 a share in regular trading.

October 15, 2008, Bernstein lowered IBM's (IBM) target to $110 from $134, EMC's (EMC) target to $12.50 from $15.50 and Sun Microsystems' (JAVA) target to $6 from $9 to reflect the economic outlook, strengthened and the credit crunch.

In the next day, The Register suggests that the downturn on the global stock markets may be good news for some financially-strapped IT vendors, as they may make the move to go private. One company that may consider going private is Sun Microsystems (JAVA), which, the Register says, is not spending enough time selling its products and building up its channels. Other companies that may look to go private are Novell (NOVL), Silicon Graphics (SGIC) and Cray (CRAY). If the companies don't go private, another suggestion is for them to be acquired.

Related Posts :
  1. 10/20/2008 - Upgrade & Downgrade
  2. 10/20/2008 - Long & Short Ideas for Tuesday
  3. 10/20/2008 - As Oil heading toward $50, Buy DUG
Sources :
  1. The New York Times: Sun Microsystems Expects Quarterly Loss, October 20, 2008
  2. theflyonthewall
Please Note!
This is generally never true. Before buying or selling any stock you should do your own research and reach your own conclusion. See my Disclaimer on the bottom for more information.

You are welcome to republish this article, or any portion thereof.
Please, cite the actual/original source. I would be grateful if you could link back.


Stumble Upon Toolbar Add to Technorati Favorites Bookmark and Share

10/20/2008 - Upgrade & Downgrade

Applied Materials (AMAT), Intel (INTC)

Goldman Sachs upgrades Applied Materials, downgrades Intel

Analyst James Covello raised his Semiconductor Capital Equipment coverage view to attractive from neutral as three rules he uses to upgrade cyclical stocks have been finally met:
  1. Trough margins
  2. Management capitulation
  3. Signs of life on the horizon that fundamentals are poised to improve.
He raised Applied Materials (AMAT) to buy from sell, and added the stock to Goldman's Conviction Buy List. Covello notes that with the shares down 32% since his downgrade on January 3, 2007, vs. the S&P 500's decline of 33%, AMAT's valuation is now too low to ignore as the stock trading at around $12 or 15 times normalized EPS vs. 21 times in early 2008. Hew raised his $14.50 price target to $15. He cut his rating on Intel (INTC) to neutral from buy.

Research in Motion (RIMM)

Pacific Crest sees risk to Q3 results, keeps sector perform

Analyst James Faucette says his checks indicate BlackBerry handset sell-through through the middle of October is slightly disappointing. Faucette believes early sell-through of BlackBerry Flip at T-Mobile is particularly disappointing. The analyst notes execution problems plaguing Curve in Canada and Bold sales in the UK. He believes the company's (RIMM) third quarter guidance is based on stellar November sales, and is increasingly reliant upon aggressive and successful ramps of BlackBerry Storm and BlackBerry Bold in the U.S.

Faucette maintains his 96 cents third quarter EPS estimate and his $3.63 fiscal 2009 (Feb.) forecast. He maintains his sector perform rating on the shares.

Anadarko Petroleum

FBR Capital upgrades to outperform from market perform

Analyst Rehan Rashid says large-cap exploration and production firms are relative beneficiaries in this market environment with stronger balance sheets, access to capital, deep asset inventories to diversify risk, and liquids exposure. He says Anadarko (APC) upgrade reflects valuation, pending exploratory catalyst. In addition, he notes Anadarko management execution continues to de-lever the company's balance sheet, and the company has about 95% of its Rockies basis hedged for next year. Rashid believes Anadarko is trading at a steep discount to his revised net asset value (NAV) of $56 per share. He says his $50 price target is a slight discount to proved NAV.


Related Posts :
  1. 10/20/2008 - Long & Short Ideas for Tuesday
  2. 10/20/2008 - As Oil heading toward $50, Buy DUG

Sources :
Please Note!
This is generally never true. Before buying or selling any stock you should do your own research and reach your own conclusion. See my Disclaimer on the bottom for more information.

You are welcome to republish this article, or any portion thereof.
Please, cite the actual/original source. I would be grateful if you could link back.


Stumble Upon Toolbar Add to Technorati Favorites Bookmark and Share

Iceland receives $6 bln rescue package

A branch of the Icelandic bank Glitnir in Reykjavik on October 8, 2088. The Icelandic state has officially taken control of the country's third largest bank, Glitnir, the Financial Supervisory Authority (IFSA) said today. AFP PHOTO OLIVIER MORIN (Photo credit should read OLIVIER MORIN/AFP/Getty Images)
4:05 p.m. ET, 10/9/08 - Photo courtesy of MSNBC

Iceland is set to receive a US$6-billion IMF-led rescue package soon, Britain's Financial Times reported on Monday. The IMF may provide about $1 billion in emergency cash for Iceland with the balance lent by Norway, Sweden and Denmark and additional money possibly coming from Russia and Japan.

It was not known whether Russia, which has been in talks with Iceland over a loan, would take part in the plan. A first round of negotiations with Russia finished last week without a loan deal. Iceland did, however, tap the central banks of Denmark and Norway for 200 million euros each based on a swap facility previously set up with Nordic central banks.

Iceland has been in dire need of financial help since the government found itself having to take control of the last of the country’s three major banks, Kaupthing. Along with the other two banks, Landsbanki and Glitnir, Kaupthing was brought down by the weight of debts, denominated mainly in foreign currency, that it was unable to refinance.

French government announced today that it will buy 10.5 billion euros, or about $14 billion, of subordinated debt from six major lenders in exchange for a pledge that they will increase lending to businesses and consumers. The announcement was part of the 380 billion euro bailout plan the government announced last week. In the first instalment of that plan, Lagarde said Monday that BNP Paribas would get 2.6 billion euros, Société Générale 1.7 billion and Crédit Agricole 3 billion. Three unlisted savings banks — Caisse d'Epargne, Crédit Mutuel and Banque Populaire — will share the remainder of the funds. European markets edge higher after the bank rescue announcement.

Related Posts :
  1. Sweden guarantees $200 billion in bank loans, Oil Heads Toward $50, India Lowers Key Rate for the First Time Since 2004
  2. $365 bln of Lehman CDS is going to be settled tomorrow
  3. Bernanke: More stimulus help is "appropriate" (Update 1)
  4. Will Hungary be the next Iceland?
  5. Netherlands Injects ING $13.4 Billion, China's Economic Growth Slowed, South Korea Guarantees Foreign Deposits
  6. Iceland Meltdowns
Sources :
  1. Financial Post: Iceland to receive US$6B IMF rescue package: report, October 20, 2008
  2. International Herald Tribune: European markets edge higher after bank rescue, Asia is mixed, October 21, 2008
  3. The New York Times: Iceland Poised to Get $6 Billion Rescue Package, October 20, 2008
Please Note!
This is generally never true. Before buying or selling any stock you should do your own research and reach your own conclusion. See my Disclaimer on the bottom for more information.

You are welcome to republish this article, or any portion thereof.
Please, cite the actual/original source. I would be grateful if you could link back.


Stumble Upon Toolbar Add to Technorati Favorites Bookmark and Share

10/20/2008 - Long & Short Ideas for Tuesday

Long :

  1. Barrick Gold Corporation (ABX)

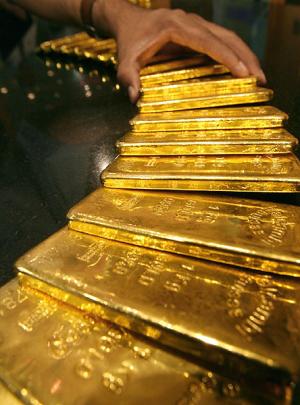
    A Gold miner can be safe heaven in times of troubles. Barrick has reserves of 124.6 million ounces of gold, worth about $100 Billion 6.2 billion pounds of copper worth about $18 Billion. The third Quarter Results will be Released on October 30th before market open.

    The company's P/E = 15, Quarterly Revenue Growth 19.80% yoy, and Quarterly Earnings Growth 22.50% yoy.

    Chart courtesy of Stockcharts (Click to enlarge)

    Photo courtesy of Deminvest (Click to enlarge)


  2. Questar Corp. (STR)

    The company's natural gas and oil-equivalent production will come in at the high end of its previous guidance of 166-169 billion cubic feet equivalent. The company estimates that Questar E&P 2009 production may still grow 10-15% from 2008 levels. The recent candles form three bulls warrior. The prices are also being supported by a double bottoms line around $22.5

    Chart courtesy of Stockcharts (Click to enlarge)
Short :


Related Posts :
  1. 10/20/2008 Market Recap - Positive Signs in Credit Market (Update 2)
  2. $365 bln of Lehman CDS is going to be settled tomorrow
  3. 10/20/2008 - As Oil heading toward $50, Buy DUG
  4. 10/18/2008 - Long & Short Ideas for Monday
Sources :
Please Note!
This is generally never true. Before buying or selling any stock you should do your own research and reach your own conclusion. See my Disclaimer on the bottom for more information.

You are welcome to republish this article, or any portion thereof.
Please, cite the actual/original source. I would be grateful if you could link back.


Stumble Upon Toolbar Add to Technorati Favorites Bookmark and Share

10/20/2008 Market Recap - Positive Signs in Credit Market (Update 2)

Chart courtesy of http://finance.google.com

A rising wave of optimism lifted Wall Street Monday, propelling the Dow Jones industrials up more than 400 points on more signs of a reviving credit market and support from Federal Reserve Chairman Ben Bernanke for further steps to aid the economy. All the major indexes finished with gains of 3 percent or more.The market liked what Bernanke had to say, and there were hints that he's leaving the door open for further moves in terms of rate cuts or economic stimulus

The credit markets were gradually responding to the series of bailout measures by governments around the world, including a joint U.S. and European plan to buy stakes in private banks to boost their lending. Demand for Treasury bills, regarded as the safest assets around, lessened Monday but remained relatively high in a sign that there was still much fear in the markets. Investors became more optimistic as bank-to-bank lending rates eased further. There's also less demand for ultra-safe Treasury bills, another sign that the credit markets are gradually returning to a healthier state.

In Asia on Tuesday morning, stocks opened higher. The Nikkei index in Tokyo was up 1.5 percent and the Seoul composite in South Korea was trading up 1.6 percent.

A trader in New York on Monday. (Brendan McDermid/Reuters)
Chart courtesy of International Herald Tribune

The S&P chart below looks like it’s working on a symmetrical triangle, it’s likely bad news for the bulls since those are often continuation patterns.

Chart courtesy of Trader Mike (Click to enlarge)

Here is my summary of Cobra's Market View's analysis about prediction of the market direction tomorrow:
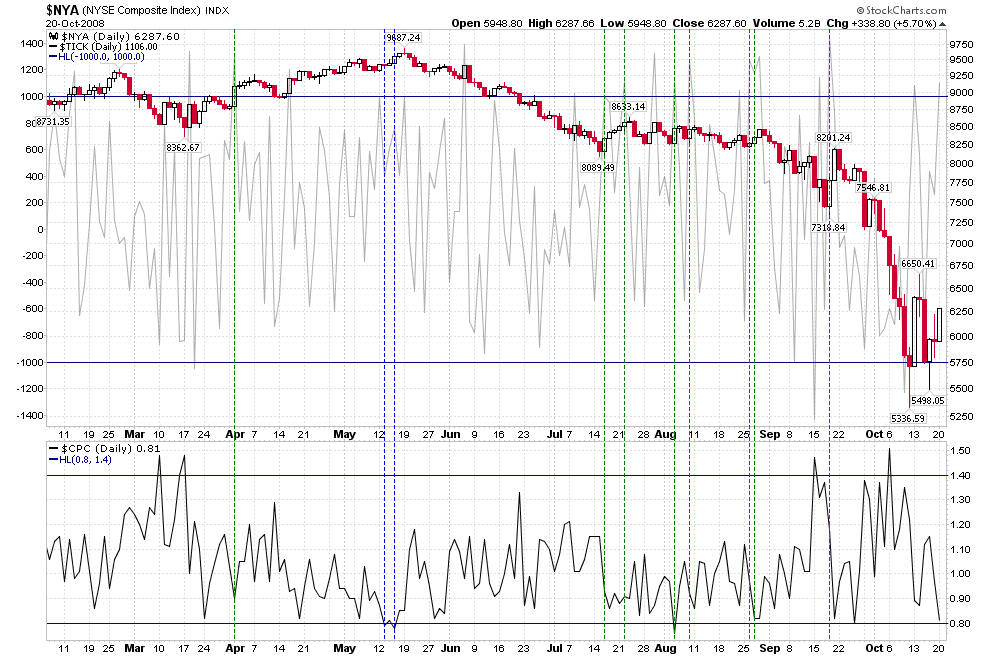
    Suggesting that TICK closes above 1,000 it means there is very high chances that the 2nd day the market will close lower and the same is true for CPC if it closes around 0.8. Is it true? Check the following chart, see dashed lines, at least the writer don't see any edges here.

    Chart courtesy of Cobra's Market View (Click to enlarge)

    RSI rarely reverses after a single overbought/oversold. Usually it has to enter into oversold/overbought twice and form a divergence before reversal. From this perspective, RSI just went overbought and may pull back tomorrow morning. Afterward it might likely rise again and form a double overbought.

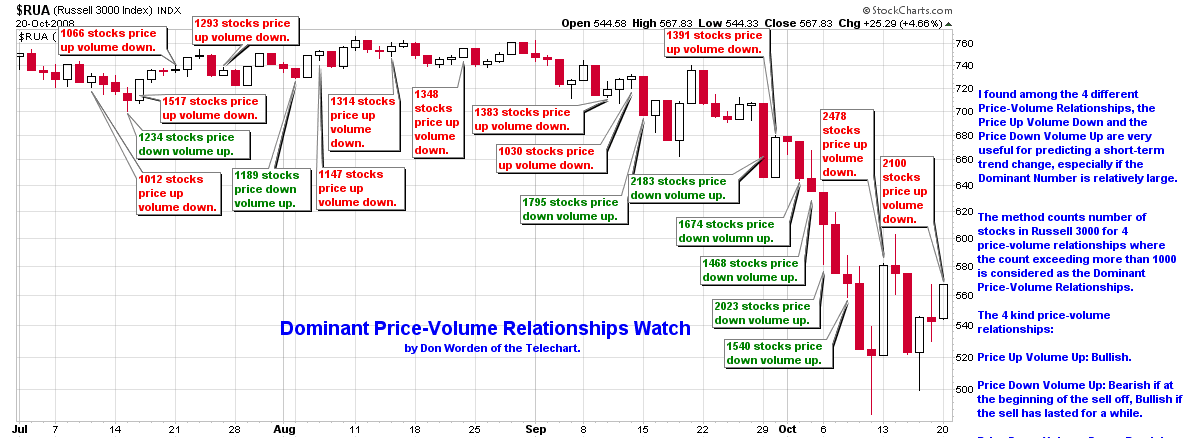
    Russell 3000 Dominant Price-Volume Relationships below shows the dominant price-volume relationships are 2100 stocks price up volume down, which is very bearish. According to the past statistics, the market may drop down tomorrow or as late as the next day. Therefore if RSI does go up for forming a double top, pay attention to the volume and be cautious to the day after tomorrow.

    Chart courtesy of Cobra's Market View (Click to enlarge)

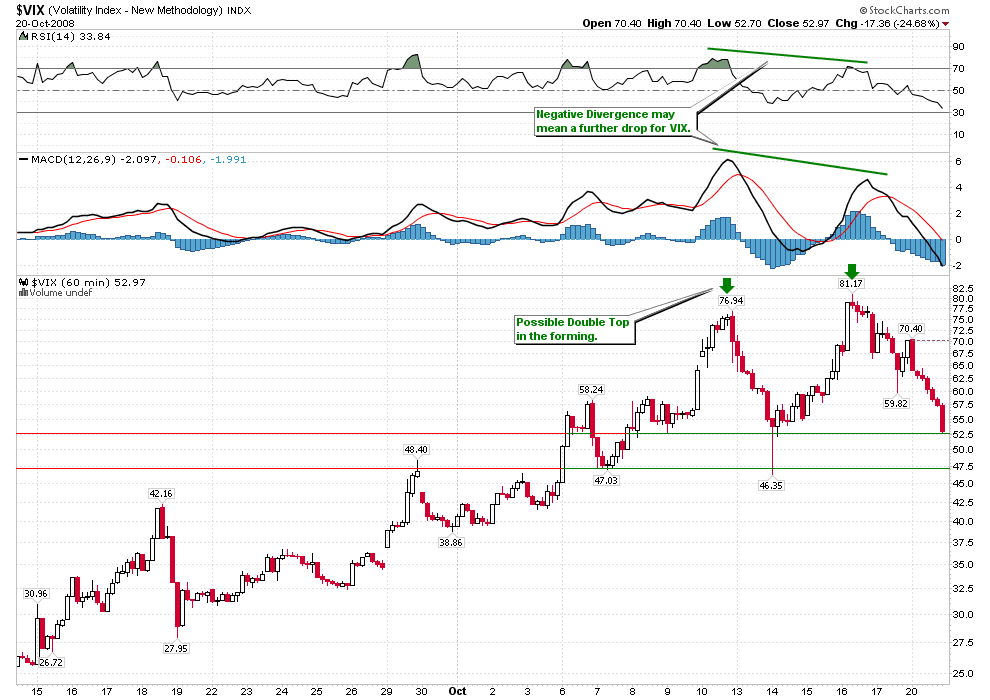
    But Overall the market trend is likely on the mid-term bullish. The pattern on VIX is likely a double top, and the negative divergence on MACD and RSI shows that VIX may drop down further, which is bullish to the market.

    Chart courtesy of Cobra's Market View (Click to enlarge)

Related Posts :
  1. Bernanke: More stimulus help is "appropriate" (Update 1)
  2. Sweden guarantees $200 billion in bank loans, Oil Heads Toward $50, India Lowers Key Rate for the First Time Since 2004
Sources :
  1. Cobra's Market View: 10/20/2008 Market Recap: One more buy signal, October 20, 2008
  2. Cobra's Market View: $TICK closes above 1,000 means the market will close lower the 2nd day?, October 20, 2008
  3. Market News of Money AOL: Wall Street higher on hopes of credit recovery, October 20, 2008
  4. Trader Mike: October 20, 2008 Recap: Range & Volume Contraction

Please Note!
This is generally never true. Before buying or selling any stock you should do your own research and reach your own conclusion. See my Disclaimer on the bottom for more information.

You are welcome to republish this article, or any portion thereof.
Please, cite the actual/original source. I would be grateful if you could link back.


Stumble Upon Toolbar Add to Technorati Favorites Bookmark and Share