
A rising wave of optimism lifted Wall Street Monday, propelling the Dow Jones industrials up more than 400 points on more signs of a reviving credit market and support from Federal Reserve Chairman Ben Bernanke for further steps to aid the economy. All the major indexes finished with gains of 3 percent or more.The market liked what Bernanke had to say, and there were hints that he's leaving the door open for further moves in terms of rate cuts or economic stimulus
The credit markets were gradually responding to the series of bailout measures by governments around the world, including a joint U.S. and European plan to buy stakes in private banks to boost their lending. Demand for Treasury bills, regarded as the safest assets around, lessened Monday but remained relatively high in a sign that there was still much fear in the markets. Investors became more optimistic as bank-to-bank lending rates eased further. There's also less demand for ultra-safe Treasury bills, another sign that the credit markets are gradually returning to a healthier state.
In Asia on Tuesday morning, stocks opened higher. The Nikkei index in Tokyo was up 1.5 percent and the Seoul composite in South Korea was trading up 1.6 percent.

Chart courtesy of International Herald Tribune
The S&P chart below looks like it’s working on a symmetrical triangle, it’s likely bad news for the bulls since those are often continuation patterns.

Here is my summary of Cobra's Market View's analysis about prediction of the market direction tomorrow:
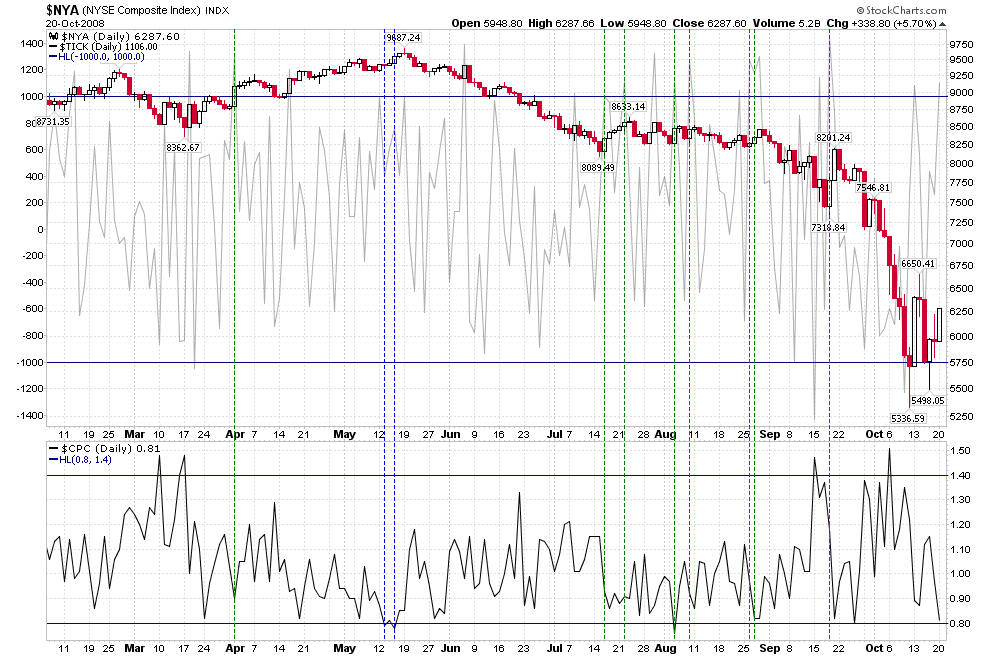
- Suggesting that TICK closes above 1,000 it means there is very high chances that the 2nd day the market will close lower and the same is true for CPC if it closes around 0.8. Is it true? Check the following chart, see dashed lines, at least the writer don't see any edges here.
RSI rarely reverses after a single overbought/oversold. Usually it has to enter into oversold/overbought twice and form a divergence before reversal. From this perspective, RSI just went overbought and may pull back tomorrow morning. Afterward it might likely rise again and form a double overbought.
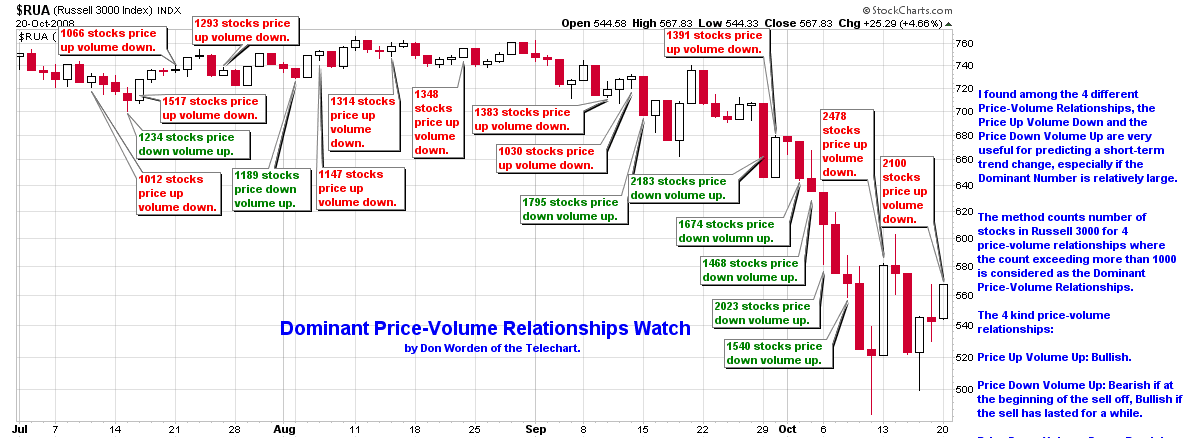
Russell 3000 Dominant Price-Volume Relationships below shows the dominant price-volume relationships are 2100 stocks price up volume down, which is very bearish. According to the past statistics, the market may drop down tomorrow or as late as the next day. Therefore if RSI does go up for forming a double top, pay attention to the volume and be cautious to the day after tomorrow.
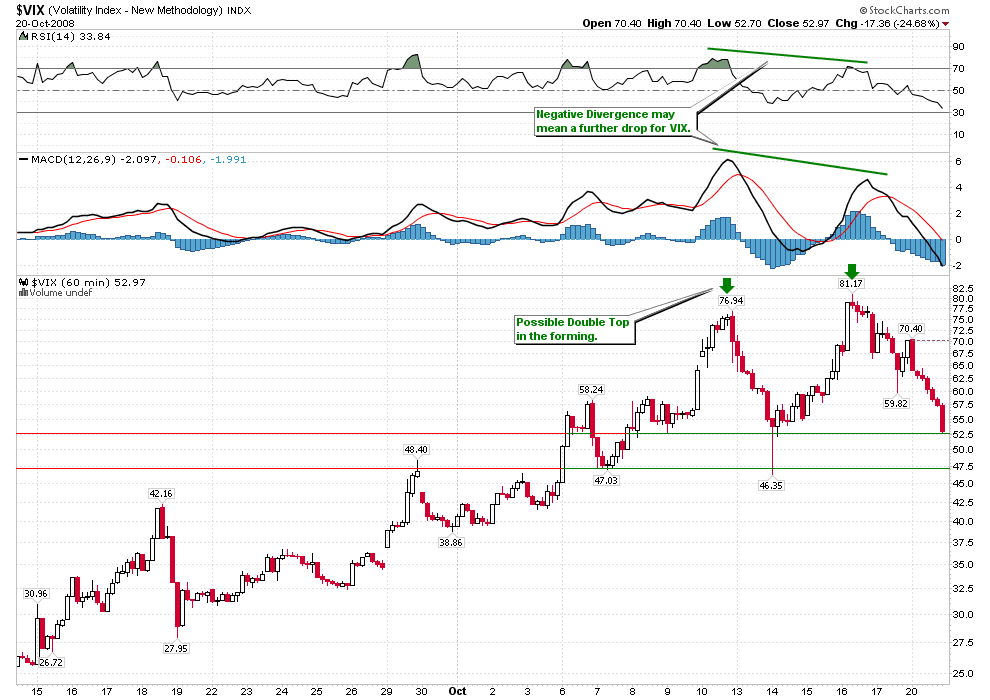
But Overall the market trend is likely on the mid-term bullish. The pattern on VIX is likely a double top, and the negative divergence on MACD and RSI shows that VIX may drop down further, which is bullish to the market.
- Bernanke: More stimulus help is "appropriate" (Update 1)
- Sweden guarantees $200 billion in bank loans, Oil Heads Toward $50, India Lowers Key Rate for the First Time Since 2004
- Cobra's Market View: 10/20/2008 Market Recap: One more buy signal, October 20, 2008
- Cobra's Market View: $TICK closes above 1,000 means the market will close lower the 2nd day?, October 20, 2008
- Market News of Money AOL: Wall Street higher on hopes of credit recovery, October 20, 2008
- Trader Mike: October 20, 2008 Recap: Range & Volume Contraction
Please Note!
This is generally never true. Before buying or selling any stock you should do your own research and reach your own conclusion. See my Disclaimer on the bottom for more information.
You are welcome to republish this article, or any portion thereof.
Please, cite the actual/original source. I would be grateful if you could link back.





No comments:
Post a Comment