Translate this page from English into :

Thursday, August 28, 2008

IEA Ready to Release Oil Stocks If Storm Hits


According to Reuters today, The International Energy Agency (IEA) is ready to release strategic oil stocks if Tropical Storm Gustav hits the Gulf of Mexico oil hub early next week, the energy adviser to 27 rich nations said on Thursday. "It's too early to think of any implications yet but we are closely following this with the U.S. government," Aad van Bohemen, head of the emergency planning and the preparation division at the IEA. Crude oil fell more than $2 a barrel after IEA's state.

As Bloomberg wrote :
    "The IEA is making the right soothing noises to calm the market," said Phil Flynn, senior trader at Alaron Trading Corp. in Chicago. "Anyone who follows the industry would expect them to release supplies if there was a great deal of damage, but this is an emotional market and words can do a lot."

    The Gulf of Mexico is home to 26 percent of U.S. oil output and 14 percent of the country's gas production. Katrina closed 95 percent of offshore output in the region. Almost 19 percent of U.S. refining capacity was idled because of damage and blackouts caused by Katrina and Rita.

    Gustav is the seventh named storm of the Atlantic hurricane season, which runs from June 1 through Nov. 30. The National Oceanic and Atmospheric Administration's forecasters predict 14 to 18 named storms will develop this year.

    Brent crude oil for October settlement fell $2.05, or 1.8 percent, to settle at $114.17 a barrel on London's ICE Futures Europe exchange.

The chart below is An update on the latest production numbers from the EIA along with graphs/charts of different oil production forecasts.

Click to Enlarge
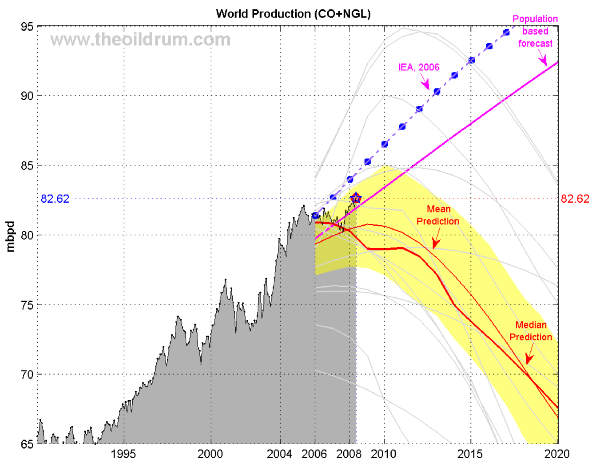
World oil production (EIA Monthly) for crude oil + NGL. The median forecast is calculated from 14 models that are predicting a peak before 2020 (Bakhtiari, Smith, Staniford, Loglets, Shock model, GBM, ASPO-[70,58,45], Robelius Low/High, HSM). 95% of the predictions sees a production peak between 2008 and 2010 at 77.5 - 85.0 mbpd (The 95% forecast variability area in yellow is computed using a bootstrap technique).

Click to Enlarge
As shown by the USO chart above, it has the parabolic shape as George Soros said on Interview with Telegraph TV on April 6:
    "Speculation... is increasingly affecting the price, The price has this parabolic shape which is characteristic of bubbles".

Related Posts :
  1. George Soros and Our "Superbubble"
  2. George Soros and Paul Tudor Jones Commented on Oil Bubble
Please Note!
This is generally never true. Before buying or selling any stock you should do your own research and reach your own conclusion. See my Disclaimer on the bottom for more information.

You are welcome to republish this article, or any portion thereof.
Please, cite the actual/original source. I would be grateful if you could link back.



Stumble Upon Toolbar Add to Technorati Favorites Bookmark and Share

George Soros and Our "Superbubble"


From OnPointRadio.org, As the economy shakes, a conversation with George Soros on July 9 :
    Billionaire investor, philanthropist, and political player George Soros made his fortune riding the winds of high finance.

    Now, he says, the global economy is blowing out of a tremendous bubble. Not a normal bubble, but a “superbubble” that’s coming apart in a superbust.

    Soros was there for the dawn of the hedge fund and the high-leverage finance that’s now coming back to bite — in housing and oil and debt and a credit crunch. We’re in for financial destruction and a breakdown of world order, he says. Oh, great.
George Soros, through his Soros Fund Management LLC, hiked his stake in Lehman Brothers Inc. (LEH) to 9.5 million shares as of June 30 from just 10,000 shares, giving him a 1.4% stake, according to a regulatory filing on August 15. It shows Soros is betting that Lehman won't befall the same fate as Bear Stearns.

Related Posts :

George Soros and Paul Tudor Jones Commented on Oil Bubble

Please Note!
This is generally never true. Before buying or selling any stock you should do your own research and reach your own conclusion. See my Disclaimer on the bottom for more information.

You are welcome to republish this article, or any portion thereof.
Please, cite the actual/original source. I would be grateful if you could link back.


Stumble Upon Toolbar Add to Technorati Favorites Bookmark and Share

A New Hundreds of Billions Dollar of Debt Coming Due

From WSJ:
    U.S. and European banks, already burdened by losses and concerns about their financial health, face a new challenge: paying off hundreds of billions of dollars of debt coming due.

    At issue are so-called floating-rate notes -- securities used heavily by banks in 2006 to borrow money. A big chunk of those notes, which typically mature in two years, will come due over the next year or so, at a time when banks are struggling to raise fresh funds. That's forcing banks to sell assets, compete heavily for deposits and issue expensive new debt.

    Most of the floating-rate notes are denominated in dollars. But redemptions of notes denominated in euros also loom for European and U.S. banks. In the final four months of this year, some €15 billion to €20 billion will come due every month, says Mr. Stear, the Société Générale strategist. That compares with some €7 billion to €15 billion that came due every month in the first half of 2008.

    The crunch will begin next month, when some $95 billion in floating-rate notes mature. J.P. Morgan Chase & Co. analyst Alex Roever estimates that financial institutions will have to pay off at least $787 billion in floating-rate notes and other medium-term obligations before the end of 2009. That's about 43% more than they had to redeem in the previous 16 months.

    The problem highlights how the pain of the credit crunch, now entering its second year, won't end soon for banks or the broader economy. The Federal Deposit Insurance Corp. said on Tuesday that its list of "problem" banks at risk of failure had grown to 117 at the end of June, up from 90 at the end of March.

    "It's going to be a bigger problem now than it was in the first half of this year, but it's going to continue on for probably at least a nine-month period," said Guy Stear, credit strategist at Société Générale SA in Paris.

    By the end of this year, big banks and investment banks such as Goldman Sachs Group Inc. (GS), Merrill Lynch & Co (MER), Morgan Stanley (MS), Wachovia Corp. (WB), and U.K. lender HBOS PLC must each redeem more than $5 billion in floating-rate notes, according to a recent report from J.P. Morgan (JPM). Other big lenders such as General Electric Co. (GE), Wells Fargo & Co. (WFC) and Italy's UniCredit Group also face big bills in coming months, the report says.
From Bloomberg :
    Banks sold $960.8 billion of so-called floaters between 2005 and 2007. About $260 billion, or about 30 percent, of the debt coming due in the remainder of this year is floating-rate notes. According to Alex Roever, a short-term debt analyst at JPMorgan in New York, Banks wanted to borrow the money at the cheapest levels possible and floating-rate notes helped them achieve that.

    Banks are raising rates on certificate of deposits to attract cash from new customers. Banks may be able to raise at most $110 billion in floating- rate notes, less than half the amount coming due

Related Posts :
  1. Banks' Subprime Losses Top $500 Billion on Writedowns
  2. Michael Hecht Cut His Estimates and Price Target on Lehman Brothers (LEH)
Please Note!
This is generally never true. Before buying or selling any stock you should do your own research and reach your own conclusion. See my Disclaimer on the bottom for more information.

You are welcome to republish this article, or any portion thereof.
Please, cite the actual/original source. I would be grateful if you could link back.


Stumble Upon Toolbar Add to Technorati Favorites Bookmark and Share

50 SPX Stocks Down > 50%

From The Big Picture:
    Via Mike Panzner, comes this list of the 50 down 50:

    Since the S&P 500 hit a closing peak of 1565.15 on October 9th, the benchmark has lost 18.11% (through this morning). However, 50 stocks, or 10% of the index constituents, have actually fallen by more than 50%. Not surprisingly, the biggest losers are financials, though the list also includes a few dogs from the auto, newspaper and technology sectors, among others.

    I am curious about the following: How many times has this happened before? What did the markets do 6, 12 and 24 months afterwards?

    Click through for the infamous 50:

    50 Stocks Down 50% or more from the S&P500

    Freddie Mac FRE -95.16%
    Fannie Mae FNM -92.52%
    Wamu Inc WM -89.75%
    Mbia Inc MBI -84.53%
    Natl City Corp NCC -80.85%
    Mgic Invt Corp MTG -80.14%
    Lehman Bros Hldg LEH -79.38%
    E*Trade Financia ETFC -78.65%
    Xl Capital Ltd-A XL -76.18%
    Cit Group Inc CIT -75.91%
    Regions Financia RF -73.10%
    Amer Intl Group AIG -73.04%
    General Motors GM -72.82%
    Wachovia Corp WB -72.44%
    Sandisk Corp SNDK -70.58%
    Slm Corp SLM -70.54%
    Office Depot Inc ODP -68.36%
    Tesoro Corp TSO -67.48%
    Merrill Lynch MER -66.86%
    Keycorp KEY -66.66%
    Zions Bancorp ZION -65.47%
    Whole Foods Mkt WFMI -65.46%
    Titanium Metals TIE -64.53%
    Nvidia Corp NVDA -62.63%
    First Horizon Na FHN -62.61%
    Citigroup Inc C -61.61%
    Harman Intl HAR -61.12%
    Gannett Co GCI -60.91%
    Huntington Banc HBAN -60.34%
    Qwest Communicat Q -60.28%
    Ciena Corp CIEN -60.16%
    Marshall &Ilsley MI -59.55%
    Allegheny Tech ATI -58.97%
    Fifth Third Banc FITB -58.67%
    Sun Microsystems JAVA -58.52%
    Gen Growth Prop GGP -57.64%
    Adv Micro Device AMD -55.91%
    Liz Claiborne LIZ -55.76%
    Micron Tech MU -55.64%
    American Capital ACAS -54.09%
    Meredith Corp MDP -53.58%
    Nyse Euronext NYX -53.16%
    Valero Energy VLO -53.05%
    Legg Mason Inc LM -52.77%
    Lennar Corp-Cl A LEN -52.45%
    Cb Richard Ell-A CBG -51.57%
    Comerica Inc CMA -51.53%
    Genworth Financi GNW -51.45%
    Sprint Nextel Co S -50.27%
    Sovereign Bancor SOV -50.06%

Related Posts :

Market Lessons From 2007

Please Note!
This is generally never true. Before buying or selling any stock you should do your own research and reach your own conclusion. See my Disclaimer on the bottom for more information.

You are welcome to republish this article, or any portion thereof.
Please, cite the actual/original source. I would be grateful if you could link back.


Stumble Upon Toolbar Add to Technorati Favorites Bookmark and Share

Fertilizer Risks Increased by Higher Fuel Costs

Fields of corn grow near the cattle farm of Tanner Rowe outside of Dallas Center, Iowa, June 11, 2008. Photographer: Gary Fandel/Bloomberg News

According to Bloomberg on August 27, A U.S. Department of Agriculture report today may show costs are accelerating as revenue growth slows, similar to a pattern that led to a 1980s farm crisis that was the worst since the Great Depression, said Gary Schnitkey, a University of Illinois farm economist. Corn, wheat and soybean prices are all at least 18 percent below their peaks.

Fertilizer, the second-biggest expense for corn and soybean farmers after land, is tied to spiraling energy costs, said Bob Young, chief economist for the American Farm Bureau Federation. Fertilizer costs doubled from a year ago, while fuel increased 62 percent, USDA data show. Expenses probably will surpass the $279.2 billion that the USDA estimated in February, eroding net income the government pegged at a record $92.3 billion for 2008, farmers and economists said.

"Income peaked this year," said Kurt Line, who owns or manages more than 6,800 acres of farmland near Momence, Illinois. "We should see a significant drop in 2009. For the number of dollars we will be risking the next two years, profit margins are not going to be robust."

Total farm income, a broad measure of revenue, rents, government aid and other benefits from agricultural operations, will be $371.5 billion this year, according to USDA estimates in February that will be revised in today's report. Adjusted for inflation, the figure is the highest since 1979. The USDA's first forecast of 2009 farm income will be made in November.


Related Posts :

The Agriculture's Bear Market

Please Note!
This is generally never true. Before buying or selling any stock you should do your own research and reach your own conclusion. See my Disclaimer on the bottom for more information.

You are welcome to republish this article, or any portion thereof.
Please, cite the actual/original source. I would be grateful if you could link back.


Stumble Upon Toolbar Add to Technorati Favorites Bookmark and Share