
According to Reuters today, The International Energy Agency (IEA) is ready to release strategic oil stocks if Tropical Storm Gustav hits the Gulf of Mexico oil hub early next week, the energy adviser to 27 rich nations said on Thursday. "It's too early to think of any implications yet but we are closely following this with the U.S. government," Aad van Bohemen, head of the emergency planning and the preparation division at the IEA. Crude oil fell more than $2 a barrel after IEA's state.
As Bloomberg wrote :
- "The IEA is making the right soothing noises to calm the market," said Phil Flynn, senior trader at Alaron Trading Corp. in Chicago. "Anyone who follows the industry would expect them to release supplies if there was a great deal of damage, but this is an emotional market and words can do a lot."
The Gulf of Mexico is home to 26 percent of U.S. oil output and 14 percent of the country's gas production. Katrina closed 95 percent of offshore output in the region. Almost 19 percent of U.S. refining capacity was idled because of damage and blackouts caused by Katrina and Rita.
Gustav is the seventh named storm of the Atlantic hurricane season, which runs from June 1 through Nov. 30. The National Oceanic and Atmospheric Administration's forecasters predict 14 to 18 named storms will develop this year.
Brent crude oil for October settlement fell $2.05, or 1.8 percent, to settle at $114.17 a barrel on London's ICE Futures Europe exchange.
The chart below is An update on the latest production numbers from the EIA along with graphs/charts of different oil production forecasts.
Click to Enlarge
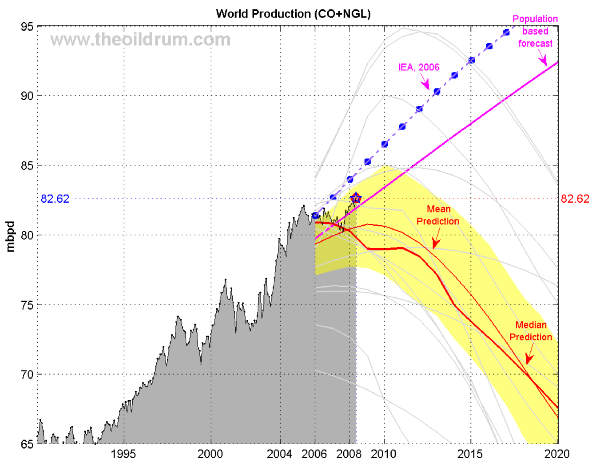 World oil production (EIA Monthly) for crude oil + NGL. The median forecast is calculated from 14 models that are predicting a peak before 2020 (Bakhtiari, Smith, Staniford, Loglets, Shock model, GBM, ASPO-[70,58,45], Robelius Low/High, HSM). 95% of the predictions sees a production peak between 2008 and 2010 at 77.5 - 85.0 mbpd (The 95% forecast variability area in yellow is computed using a bootstrap technique).
Click to Enlarge
 As shown by the USO chart above, it has the parabolic shape as George Soros said on Interview with Telegraph TV on April 6:
 - "Speculation... is increasingly affecting the price, The price has this parabolic shape which is characteristic of bubbles".
Related Posts :
Please Note!
This is generally never true. Before buying or selling any stock you should do your own research and reach your own conclusion. See my Disclaimer on the bottom for more information.
You are welcome to republish this article, or any portion thereof.
Please, cite the actual/original source. I would be grateful if you could link back.





No comments:
Post a Comment