The market action on Friday looks pretty good, but it may not mean anything because the quick rally at the end of day seems like a short covering. Because of the G7 meeting in the weekend, many bears would rather not to carry short positions to Monday. Therefore, we need a follow-through on Monday. Recently the market is very panic and many TA signals on my daily watch list have been extremely oversold, while the market has not shown any sign of recovery. Again, if you insist to catch the bottom, don't open heavy positions and don't judge the bottom simply by a few indicators. At least the first step should be a close near height of the day, unlike the last week every time the bell was to ring then the market started to sold off, which indicated that people were unconfident to hold long positions overnight. If you catch the "bottom" a few days ago, this is not the time to stop loss, but don't average down either, just be patient and wait for the confirmation of the reversal.
0.0.1 Market Top/Bottomed Watch. Look at the chart again, it is still like a bottom. However it is prudent to wait for the follow-through on Monday. The best confirmation is gap up and close near high of the day, so a Bullish Morning Star pattern is formed, then the likelihood of reversal will be high.
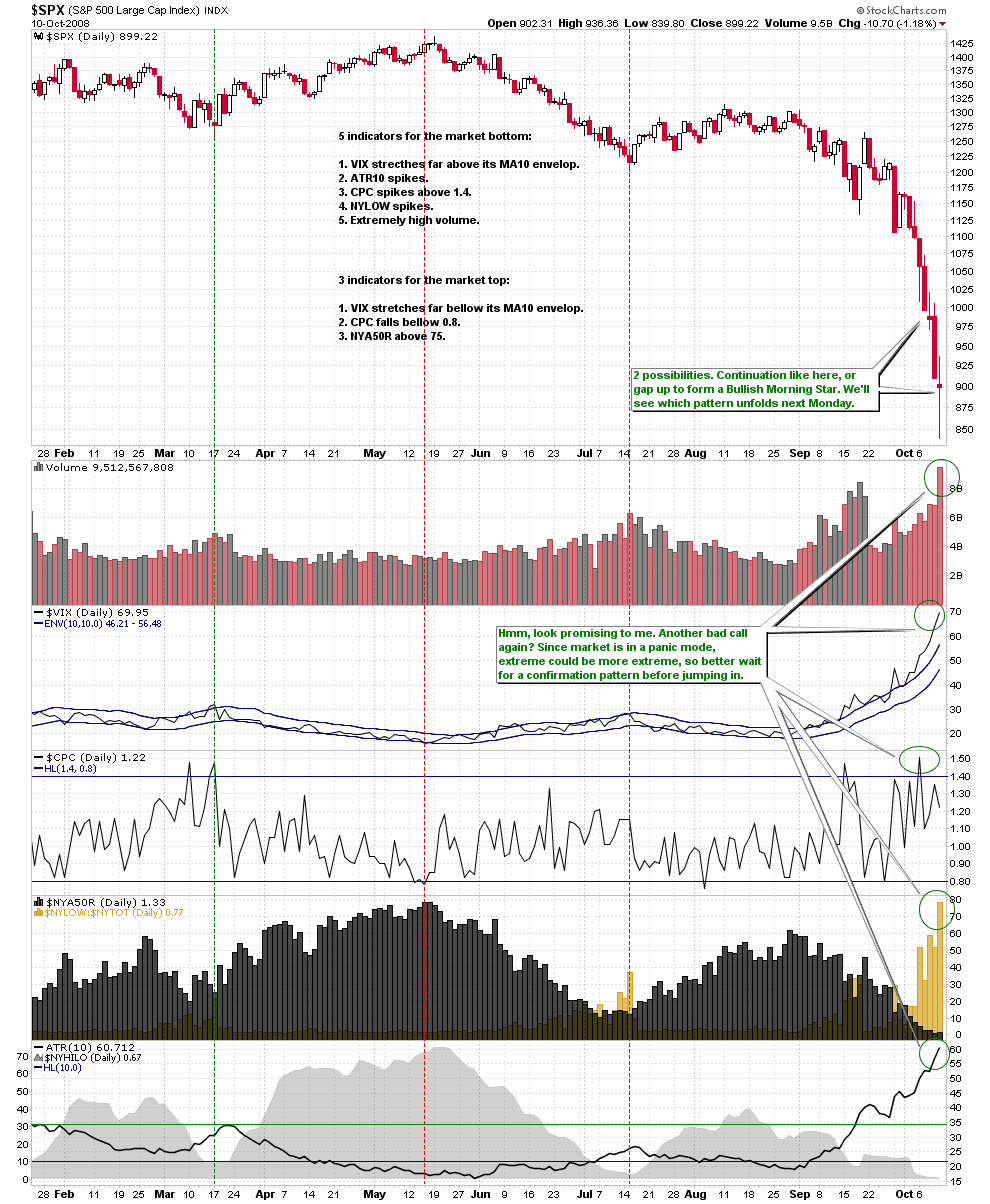
2.3.3 NYSE Total Volume. It looks like a bottom. Again, follow-through is the key.

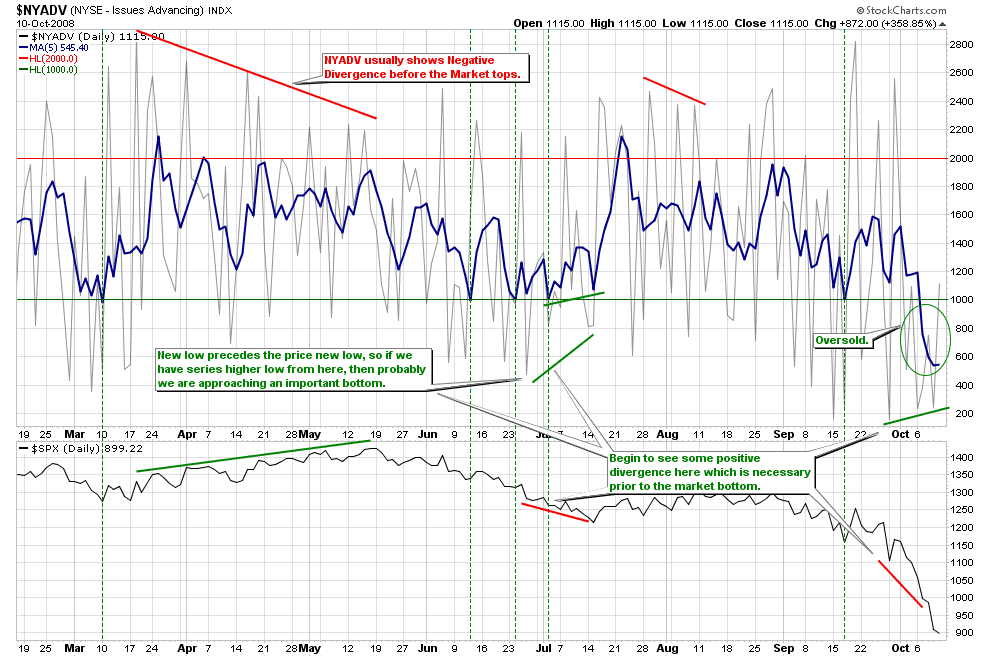
2.4.2 NYSE - Issues Advancing. NYADV is still high lows. Although the market kept dropping everyday, advancing issues didn't decrease so much, which is a good sign.
2.0.0 Volatility Index (Daily). The pattern looks like a Bearish Rising Wedge, which rallied too quickly to be sustainable. 2.0.1 Volatility Index (Weekly), on the weekly chart, this is the seventhly up week, which is the historical record.

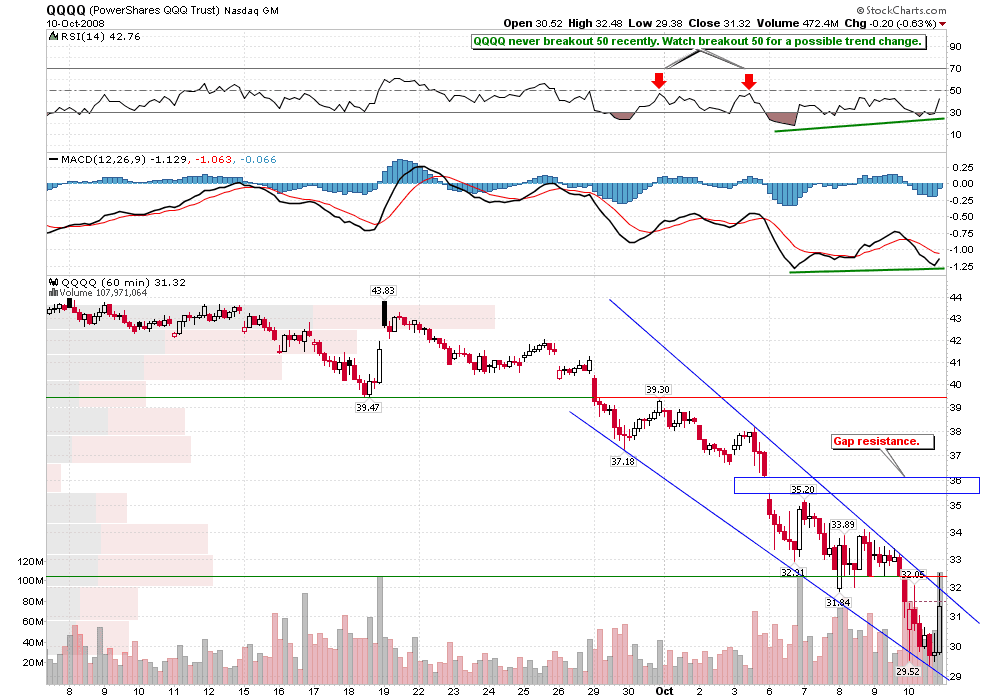
1.1.4 PowerShares QQQ Trust (QQQQ 60 min). QQQQ seems encouraging. Bullish falling wedge, and MACD and RSI show positive divergence as well. Note the RSI indicator at the top of the chart, the trend reversal won't be possible before RSI breaks above 50.
Related Posts :
- Worst. Week. Ever.
- George Soros: Global Capital Meltdown
- Short Squeeze Triggers Sharp Volatility in Stocks
- What kind of crash have we?
- Tony Oz Calls The Stock Market Bottom
- 10/09/2008 Market Recap: Is this time different?
This is generally never true. Before buying or selling any stock you should do your own research and reach your own conclusion. See my Disclaimer on the bottom for more information.
You are welcome to republish this article, or any portion thereof.
Please, cite the actual/original source. I would be grateful if you could link back.





No comments:
Post a Comment