
According to Reuters, Stocks dropped on Friday in a worldwide sell-off with investors cashing out of stocks as signs mounted that the global economic slowdown could be deeper than feared and the corporate profit outlook darkened.

It was not the bloodbath many had feared, however, even though stocks ended at 5-1/2-year lows. In the overnight hours, selling was so fierce that index futures were halted until after Wall Street's opening bell. ( see: Markets are in absolute freefall and Trading in the panic mode, futures halted )
Stock markets tumbled around the globe on Friday were due to forced liquidations by hedge funds and mutual funds to raise cash to meet large-scale redemptions by investors made the losses even steeper. The MSCI's all-country world index dropped 5 percent on more evidence of a sharp slowdown in Europe and a rash of profit warnings worldwide. ( see: 10/24/2008 - October Blues ).
A rout in Asian and European stock markets sent the Dow Jones industrial average swooning by more than 500 points in early trading in New York, but trading recovered enough ground through the day to leave the Dow down 312.30 points, or 3.6 percent.
Just a year ago, a drop of that size would have been considered a black day in the markets, but in these days of routine triple-digit declines, it offered a modicum of relief to traumatized investors.

Chart courtesy of Barclays Capital (Click to enlarge)
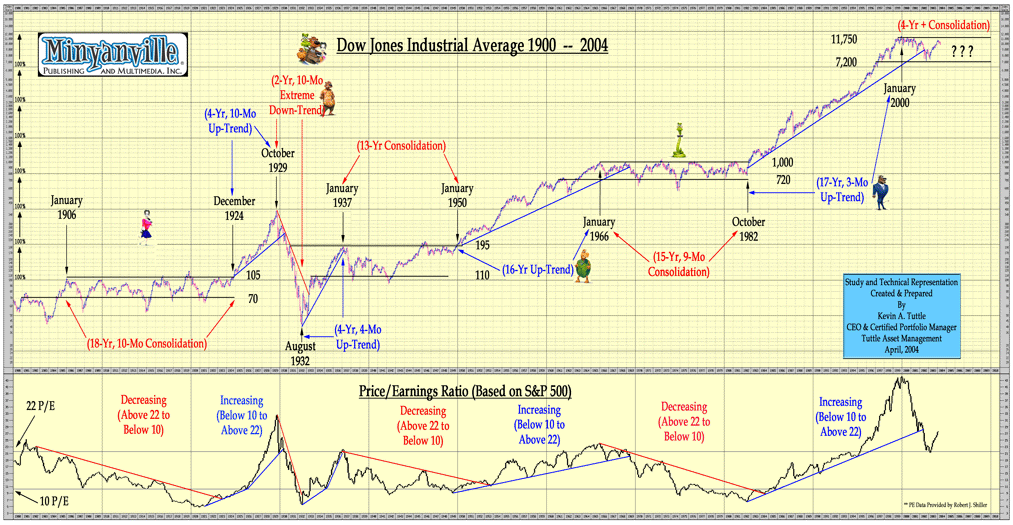
Chart courtesy of Minyanville (Click to enlarge)
Here is an article of S&P 500 forming "W" Bottom from The Big Picture :

Watch today's volume --
As seen in the chart above the 3 heaviest volume days (highlighted by green circles) in the last two weeks on SSO (Ultra S&P 500 ProShares) an ETF that seeks daily investment returns that correspond to twice (200%) the daily performance of the S&P 500 Index, were on days the index finished up in price.
This suggests accumulation and could suggest a complex bottoming formation is occurring, particularly when one looks at the recent extremes in sentiment data.
A minor downtrend line (red line) comes into play near $ 31.90. Above this level would suggest that the SSO’s are indeed forming a “W” low here. Only a high volume break below the 52 Week lows would turn the technical picture decidedly negative again.
Related Posts :
- Nouriel Roubini: Stay away from 'risky' assets
- The top 10 Benjamin Graham value plays
- 10/23/2008 - October Blues
- Trading in the panic mode, futures halted
- Markets are in absolute freefall
- The New York Times: Currencies Fall as Fears Spread and Stocks Slip, October 24, 2008
- Kathy Lien: Dollar Closing In on 5% Targets, Where are the Value Points?, October 24, 2008
- Kathy Lien: Dow Jones Industrial: Does the Past Offer Hope?, October 15, 2008
This is generally never true. Before buying or selling any stock you should do your own research and reach your own conclusion. See my Disclaimer on the bottom for more information.
You are welcome to republish this article, or any portion thereof.
Please, cite the actual/original source. I would be grateful if you could link back.





No comments:
Post a Comment