 The Dow Jones industrials ended up 400 points, after falling 380 early in the session. It is clear that investors are reacting in the extreme to any negative economic news, including disappointing numbers Thursday on industrial production that sent stocks skidding. But traders are also responding to the market's own dynamics, and when there was no late-session plunge, as there was on Wednesday, buyers piled in before the close.
The US industrial production numbers came out at 9:15ET this morning and they were very weak. Manufacturing output dropped by 2.6%, the largest monthly decline seen since May 1980. Mining output fell by 7.8%, the largest drop since September 2005. Output at utilities managed to rise 2.2% after two prior months of declines. Industrial production is 4.5% lower than its level a year earlier, and capacity use is 4.6% lower than its average level from 1972 to 2007.

However, it should be noted that the numbers were very distorted by lost production due to two hurricanes. Nevertheless, industrial production data -- along with recently released jobless claims and retail sales numbers -- represent further evidence of a recession in the United States.
Economist David H. Wang told on Thursday the Philly Fed statistic does not bode well for the U.S. economy. "This is a horrible number. Manufacturing is weakening, the recession is worsening, and lay-offs are likely to continue at a steady pace, as a result" Wang said. "We're seeing a weakening of both domestic and international demand, which suggests at least a two-quarter recession. Given this level of manufacturing decline, we will be quite fortunate to have just a two-quarter recession."
According to Credit writedowns blog, he has crunched the numbers and provided some graphs below. The numbers to look at are the raw (non-seasonally adjusted) ones to compare them on a year-on-year basis. The trend in production in the US that you see below is down. Irrespective of the one-month aberration due to the hurricanes, industrial production has been trending down since January 2008.

He also tried to strip out month-to-month volatility by presenting average data for the last 12-months and compared it to the average one year back. And while this line is smoother, you can clearly see that production in the United States is trending down. In fact, if you were a business manager or an investor looking to make decisions about the future, this chart makes the trend much clearer. In predicting a slowing in the U.S. economy, the industrial production numbers show that you would have started to make your move by early 2006. The average change in industrial production peaked in Aug-Nov of 2005.

The market fears are also driven by some bad news amid banks' writedowns. Citigroup Inc.(C) swung to a third-quarter net loss was US$2.8 bln, as much as $4.4 bln in securities and banking and blamed weak revenues across all businesses on "the impact of a difficult economic environment and weak capital markets." Citi reported a fourth consecutive quarterly loss after at least US$13.2 bln of credit losses, reserves for bad loans and writedowns for mortgage-related securities. Merrill Lynch (MER) also revealed at least $9.5 bln in write-downs, handily surpassing Fox-Pitt Kelton analyst David Trone's estimate of $8.5 bln.

The market rebound nearly on the mid-day after investors initially appeared cheered by a better-than-expected reading from the Labor Department on consumer prices. The flat reading on September's Consumer Price Index compares with August's 0.1 percent decline, which was the first in nearly two years. The core index, which eliminates often volatile food and energy prices, rose 0.1 percent. Economists had been expecting CPI would rise to 0.1 percent and that core CPI would increase 0.2 percent.
Meanwhile, a weekly snapshot of the job market showed that first-time claims for unemployment benefits declined last week. The Labor Department said new claims fell 16,000 to a seasonally adjusted level of 461,000 - below the 475,000 that had been anticipated. Still, total unemployment remains above the level that economists often associate with recession. Sweet crude fell $4.69 to settle at $69.85 a barrel on the New York Mercantile Exchange, the lowest settlement price since Aug. 23, 2007. Investors are hoping lower energy prices will leave more money in consumers' wallets.
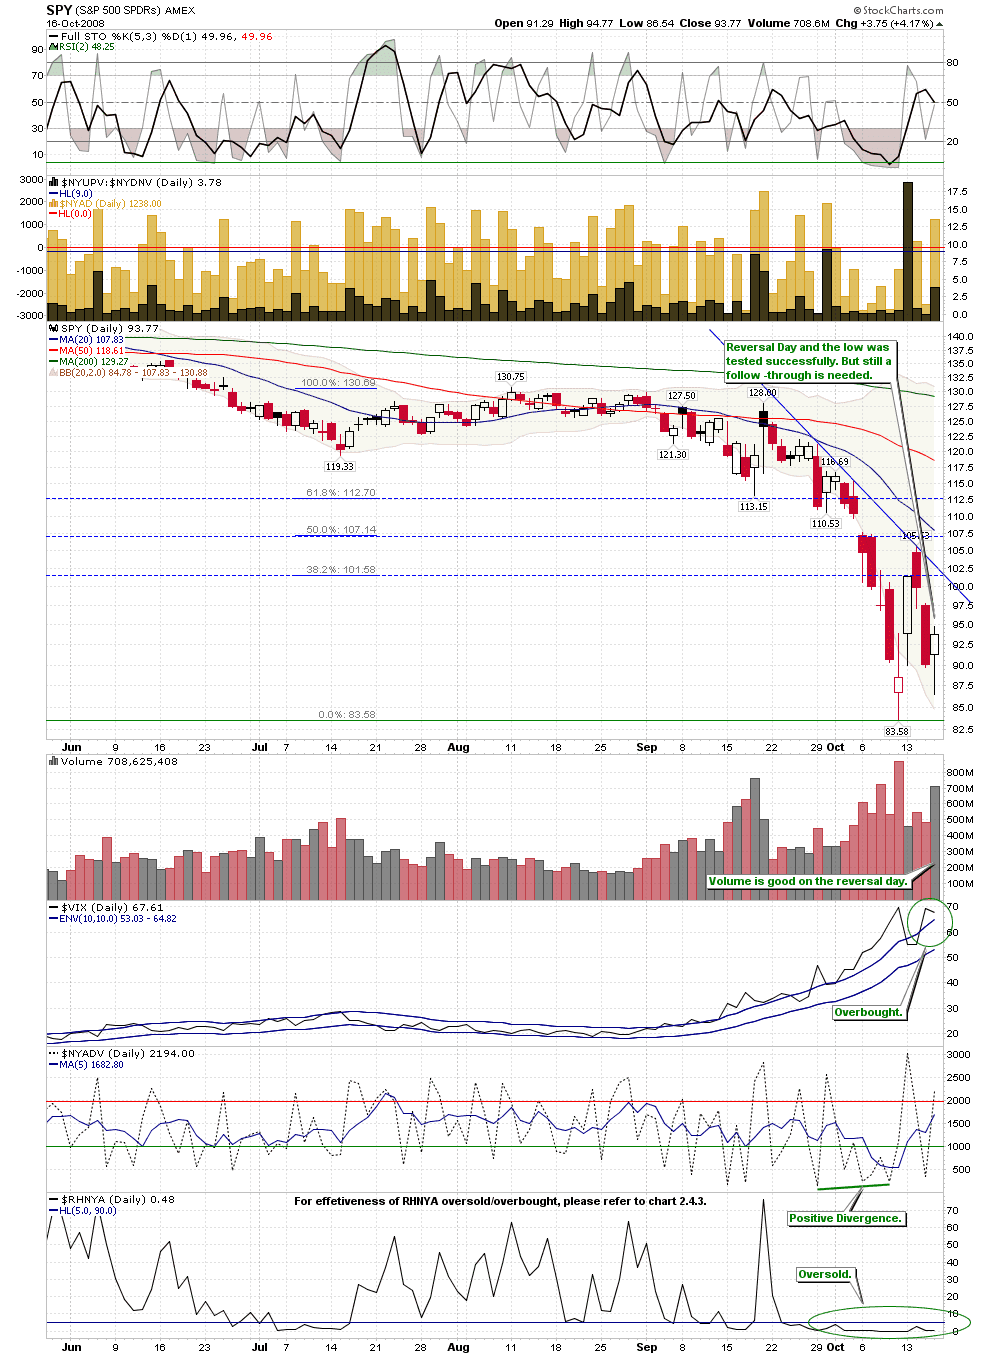
There are two more reasons that provide some ammo for the bulls. The market needed a rally and that’s just what it got bouncing big time off it’s lows of the day which could be good enough for a retest. The positive divergence isn’t perfect below, but it’s there indicating the selling could be coming to an end and people are starting to buy this bottom, even if it is just a trading bottom.
 Chart Courtesy of Zentrader.ca
The Vix is finally starting to show signs of stalling as it was outside it’s daily Bollinger band today and snapped back under selling off hard closing well off it’s highs. Tomorrow’s close will be very telling if buyers are willing to bid up the market and hold positions over the weekend knowing full well that there is always a chance of a "market huddle" from governments around the world poking their noses where they shouldn’t be. We are tired of hearing all this doom and gloom. Rage’s "Bulls on Parade".
 Chart Courtesy of Zentrader.ca
The SPY Short-term Trading Signals below shows that technically today is a Bullish Reversal Day, and the last Friday low was successfully tested. But a follow-through tomorrow is still needed.
Related Posts :
- The Market Has Almost Wiped Out the Gains From Monday's Historic Rally(Update 2)
- Energy Funds and Stocks Will Move in the Opposite Direction Against Swinging Oil Prices
- Commodities Will Pull Back Due to LoC Frozen
- Zentrader.ca: Bull Parade Coming?, October 16, 2008
- Credit writedowns: US industrial production is very weak, October 16, 2008
- BloggingStocks: Philly Fed manufacturing index plunges to lowest level in almost 20 years, October 16, 2008
- Econompic Data: Industrial Production Non-Existent in September, October 16, 2008
- Cobra's Market View: 10/16/2008 Market Recap: Bullish Reversal Day, October 16, 2008
This is generally never true. Before buying or selling any stock you should do your own research and reach your own conclusion. See my Disclaimer on the bottom for more information.
You are welcome to republish this article, or any portion thereof.
Please, cite the actual/original source. I would be grateful if you could link back.





No comments:
Post a Comment